Cocoa Commodity Elliott Wave Technical Analysis

Cocoa Elliott Wave Analysis

Cocoa Market Analysis

Cocoa prices have experienced reduced volatility since July 2024, following significant price swings in June. The commodity is expected to continue its corrective decline from the all-time high of 11,722, reached on April 19th.

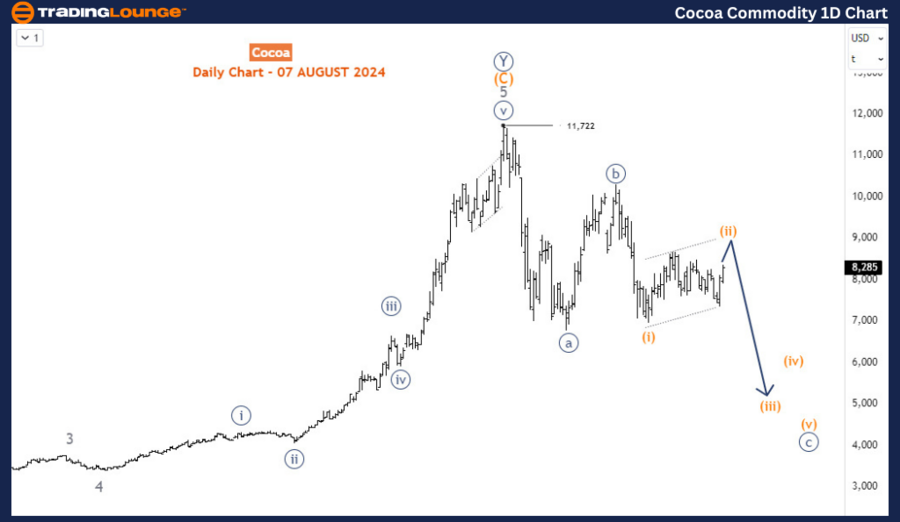
Daily Chart Analysis

On the daily chart, cocoa completed a major bullish impulse wave cycle that began in September 2022 when prices were around 2,000. By April 2024, this impulse wave had driven prices up by over 430%, culminating in an all-time high. According to Elliott Wave theory, the market typically undergoes a three-wave corrective phase after an impulse wave. The current decline from the all-time high is likely part of this corrective phase, unfolding in an a-b-c wave pattern.

In this structure, waves a and b (circled) have already been completed, and the price is now in wave c. This wave c is projected to extend lower, potentially reaching 5,000 or below before the overall bullish trend resumes. This decline aligns with the typical corrective pattern following a major impulse wave.
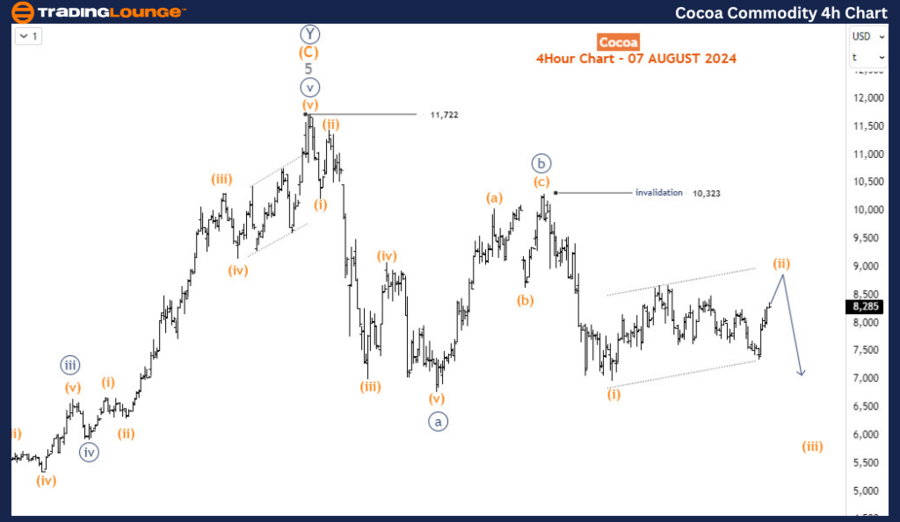
Cocoa-Commodity-1D-C...


H4 Chart Analysis

The H4 chart provides a detailed view of the sub-waves within the ongoing decline, suggesting a potential 5-3-5 corrective pattern. Within this pattern, wave c is currently progressing through its 2nd sub-wave, wave (ii), which could rally to retest the 9,000 level. As long as this bounce remains corrective and encounters resistance below the 10,323 high, the downtrend is expected to resume, driving prices toward the 5,000 major support level.

Conclusion

Cocoa is in the midst of a corrective phase following a significant bullish run. The expected continuation of the decline, especially if wave c extends as projected, presents opportunities for sellers. Traders should monitor the 9,000 and 10,323 levels for signs of resistance, which could signal the renewal of the downward trend.

Technical Analyst: Sanmi Adeagbo

Source: visit Tradinglounge.com and learn From the Experts Join TradingLounge Here 

See Previous: Natural Gas Elliott Wave Analysis 

Special Trial Offer - 0.76 Cents a Day for 3 Months! Click here

Access 7 Analysts Over 170 Markets Covered. Chat Room With Support

Cocoa-Commodity-4HR-...

Related

IBEX 35 (Spain) index Wave Technical Analysis: Bullish Trend, Impulsive Wave Count, Market Trends, and Trading Opportunities Explained

IBEX 35 (Spain) index Wave Technical Analysis: Bullish Trend, Impulsive Wave Count, Market Trends, and Trading Opportunities Explained

IBEX 35 Elliott Wave Analysis provides a detailed technical breakdown of the market trend, highlight...

Read More >
Elliott Wave Analysis: Uncover Trading Strategies on S&P 500, NASDAQ 100, DAX 40, FTSE 100 & ASX 200

Elliott Wave Analysis: Uncover Trading Strategies on S&P 500, NASDAQ 100, DAX 40, FTSE 100 & ASX 200

Our latest blog post delves into Elliott Wave analysis on major indices like the S&P 500, NASDAQ 100...

Read More >
British Pound/U.S. Dollar Forex Pair Market Analysis and Detailed Insight on GBPUSD Elliott Wave Technical Analysis

British Pound/U.S. Dollar Forex Pair Market Analysis and Detailed Insight on GBPUSD Elliott Wave Technical Analysis

The GBPUSD Elliott Wave analysis for both the day and 4-hour charts indicates a strong bullish trend...

Read More >
Wheat's price dynamics and trajectory projections: Commodities Wheat Elliott Wave Technical Analysis

Wheat's price dynamics and trajectory projections: Commodities Wheat Elliott Wave Technical Analysis

​​​​​​​Emphasizing Wheat's Elliott Wave Analysis aids in deciphering prevailing market tr...

Read More >
FTSE 100 (UK) Elliott Wave Analysis: Bullish Trend, Wave Counts, Market Forecast, and Trading Strategies for Informed Decisions

FTSE 100 (UK) Elliott Wave Analysis: Bullish Trend, Wave Counts, Market Forecast, and Trading Strategies for Informed Decisions

Our FTSE 100 Elliott Wave analysis provides valuable insights into the market's bullish trend an...

Read More >
 Achieving ASX Trading Success: XERO LIMITED - XRO Stock Analysis & Elliott Wave Forecast

Achieving ASX Trading Success: XERO LIMITED - XRO Stock Analysis & Elliott Wave Forecast

This article provides a detailed Elliott Wave analysis for XERO LIMITED (ASX:XRO). It covers share p...

Read More >

$1 for 2 Weeks

then $29 a month!

What a Special Offer!

Trade Recommendations

Unleash the power of deversified trading with our comprehensive portfolio, covering 250+ markets:

  • Stock Trades
  • Crypto Trades
  • Forex Trades
  • Commodity Trades
Elliott Wave Analysis

Gain a competitive edge with expert insights and AI-powered Elliott Wave charting into:

  • Global Indices
  • US Stocks & ASX Stocks
  • Forex & Crypto
  • Commodities
Top-Notch Trading Tools

Equip yourself with the tools of success:

  • Real-time Chat rooms
  • Elliott Wave Algorithm
  • Portfolio tools
  • TradingLevels
  • Screener
  • Trading Game
7 Elliott Wave Analysts

Stay ahead of the market with daily charts and insightful videos
Your secret to strategic trading!

JOIN HERE


Welcome to TradingLounge (ASIC A.R.No. 321187), specialists in trades, trading education and technical analysis, covering stocks, indices, commodities, forex and cryptocurrencies.

When you join TradingLounge you have access to everything we offer, including trade tools, educational content and a social platform to chat with like-minded investors.

Read more

@Copyright 2024 by tradinglounge.com

Contact Us

Australian no: 02 4787 6020

International no: +61 (2) 47876020

Pay with:

Find us on