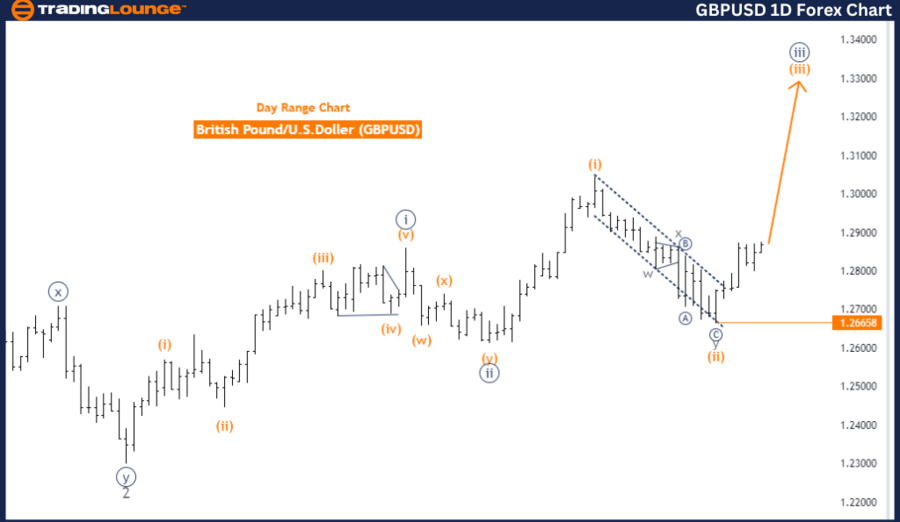
GBPUSD Elliott Wave Analysis Trading Lounge Day Chart,
British Pound/U.S. Dollar (GBPUSD) Day Chart Analysis
GBPUSD Elliott Wave Technical Analysis
Function: Trend
Mode: Impulsive
Structure: Orange Wave 3
Position: Navy Blue Wave 3
Next Lower Degree Direction: Orange Wave 4
Details: Completion of Orange Wave 2, progression of Orange Wave 3
Wave Cancel Invalid Level: 1.26658
The GBPUSD day chart, analyzed using Elliott Wave theory, indicates a trend operating in an impulsive mode. The ongoing wave structure under examination is Orange Wave 3, reflecting strong upward momentum. This wave is part of a larger Navy Blue Wave 3, reinforcing the bullish trend.
The market is currently within Navy Blue Wave 3, following the completion of Orange Wave 2. This suggests that the corrective phase represented by Orange Wave 2 has ended, and the market is now advancing into Orange Wave 3. As this impulsive wave continues, it is expected to push the market higher, aligning with the overall bullish trend.
Looking ahead, the analysis anticipates the emergence of Orange Wave 4 once Orange Wave 3 is complete. Typically, Orange Wave 4 would introduce a corrective phase within the broader trend before the market resumes its upward movement in the subsequent impulsive wave.
The Wave Cancel Invalid Level is set at 1.26658, serving as a critical threshold in this Elliott Wave analysis. Should the price dip below this level, the current wave count would be invalidated, suggesting that an alternative wave pattern may be in play or that the trend structure has shifted.
In conclusion, the GBPUSD day chart is in an impulsive trend mode, with the market currently within Orange Wave 3, part of a larger Navy Blue Wave 3. The completion of Orange Wave 2 indicates that the market is progressing with Orange Wave 3 in motion. The Wave Cancel Invalid Level at 1.26658 is crucial for confirming the continuation of this analysis.
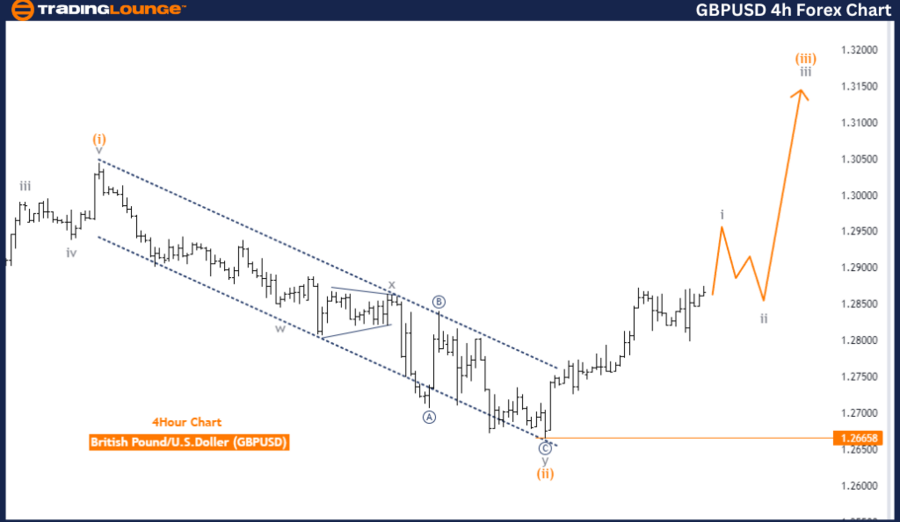
GBPUSD Elliott Wave Analysis Trading Lounge 4-Hour Chart,
British Pound/U.S. Dollar (GBPUSD) 4-Hour Chart Analysis
GBPUSD Elliott Wave Technical Analysis
Function: Trend
Mode: Impulsive
Structure: Gray Wave 1
Position: Orange Wave 3
Next Lower Degree Direction: Gray Wave 2
Details: Completion of Orange Wave 2 of 3, development of Gray Wave 1 of 3
Wave Cancel Invalid Level: 1.26658
The GBPUSD 4-hour chart, assessed through Elliott Wave theory, highlights a trend in an impulsive mode. The current wave structure observed is Gray Wave 1, which is part of the larger Orange Wave 3 formation. This suggests strong momentum, driving the price in a clear upward direction.
At present, the market is situated within Orange Wave 3, after the completion of Orange Wave 2 of 3. This indicates that the corrective phase within Orange Wave 2 has likely concluded, with the market now advancing into Gray Wave 1 of 3. This movement marks the start of a new impulsive wave within the broader trend, typically leading to further price increases in line with the prevailing trend.
The analysis forecasts the next lower degree as Gray Wave 2, expected to follow after Gray Wave 1 is fully developed. This suggests that once Gray Wave 1 of 3 is complete, the market may enter a minor corrective phase before resuming its upward trajectory within Gray Wave 3.
The Wave Cancel Invalid Level is set at 1.26658, acting as a critical point for validating this wave count. If the price drops below this level, it would invalidate the current Elliott Wave analysis, indicating a potential alternative wave pattern or a change in the trend structure.
In summary, the GBPUSD 4-hour chart is in an impulsive trend mode, with the market currently within Gray Wave 1 of 3 as part of the larger Orange Wave 3 structure. The completion of Orange Wave 2 suggests that the market is advancing, with Gray Wave 1 in progress. The Wave Cancel Invalid Level at 1.26658 is crucial for confirming the continuation of this analysis.
Technical Analyst: Malik Awais
Source: visit Tradinglounge.com and learn From the Experts Join TradingLounge Here
Previous: AUDUSD Elliott Wave Technical Analysis
Special Trial Offer - 0.76 Cents a Day for 3 Months! Click here
Access 7 Analysts Over 170 Markets Covered. Chat Room With Support