Commodities: Wheat Elliott Wave Analysis for Trend Identification
Discover insights into Wheat's market trends through Elliott Wave Technical Analysis, unveiling potential trading opportunities and projections for informed decision-making.
Wheat Elliott Wave Technical Analysis
Function - Trend
Mode - Trend
Structure - Diagonal (D1)
Position - Blue wave c of black wave Y (H4)
Direction - Downwards for blue wave c of black wave Y (H4)
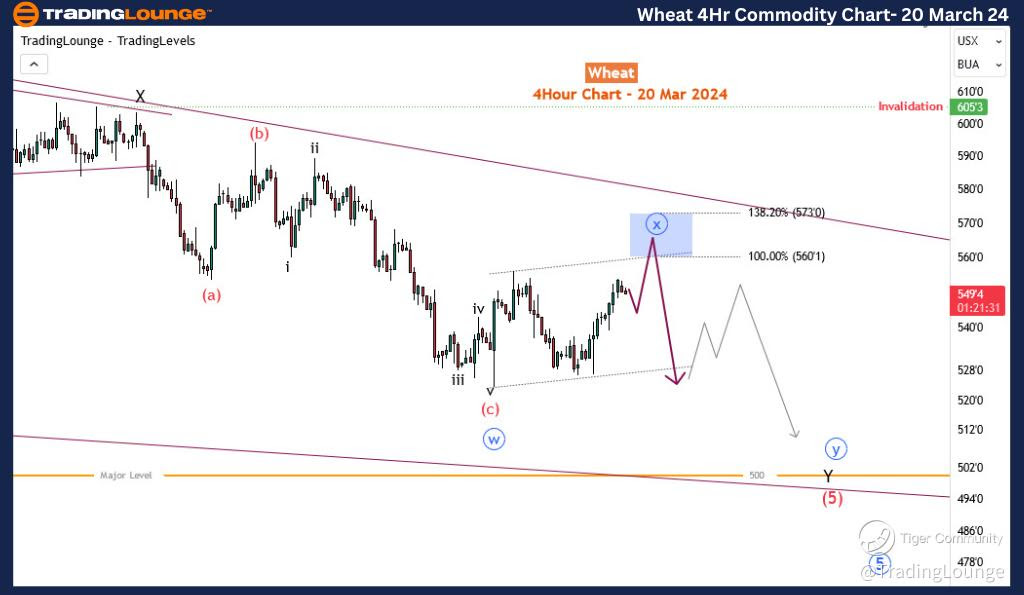
Details - The current bounce is taking a longer time and will most likely violate the last update. Here is a new one expecting a double zigzag downside with the current bounce as the connector blue wave ‘x’. This still supports a further decline toward 500.
Since 11 March, Wheat has been up by over 5%. However, this is more of a minor pullback or some profit-taking by the sellers who have dominated this market since March 2022. At some point in the short term, they will sell this current bounce. However, in the medium term, it looks like the sellers will run out of steam soon and give way to the biggest rebound since this bearish trend started two years ago. This analysis looks at the short-term and medium-term analysis and price projection for Wheat using the Elliott wave theory.
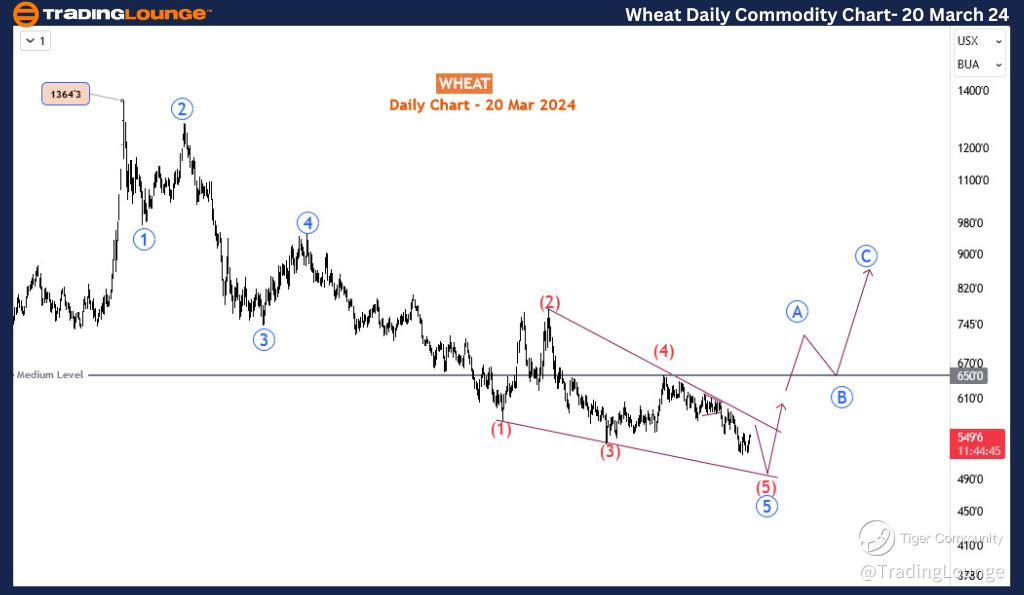
Wheat Daily Chart Analysis:
On the daily time frame, the bearish trend that has dominated for two years is completing an impulse wave. The 5th wave - wave ‘5’ in blue is about completing with an ending diagonal. Ending diagonal is one of the most effective reversal patterns in technical analysis and this is why we should look out for it. A bigger and longer bullish correction than we have seen since March 2022 is expected to follow. However, on the lower time frame, it doesn’t look as if the diagonal 5th has been completed yet. Perhaps one more leg downside will happen before the big correction.
Wheat Elliott Wave Analysis Trading Lounge 4-Hour Chart
Wheat 4-Hour Chart Analysis:
Wheat price and Elliott Wave forecast
On the 4-hour time frame, our focus is on the sub-waves of this diagonal 5th. The diagonal 5th completed its 4th sub-wave - wave (4), at 649’5 in December 2023 and since then, sellers have taken the wave (5) down as it finds completion. Wave (5) is completing a double zigzag pattern - already completed waves W and X. Wave Y is ongoing and evolving into a double zigzag as well - waves w-x-y (circled in blue). The current minor rebound is therefore the wave x (connector) of this double zigzag for Y. Wave x (circled in blue) could complete between 100% ($560) to 138.2% ($573) extension level before the last leg emerges downside to complete Y probably at 500 or thereabout. At that point, we can start discussing the end of the bearish impulse wave from March 2022.
Emphasizing Wheat's Elliott Wave Analysis aids in deciphering prevailing market trends and projecting potential price movements. By integrating pertinent keywords such as "Wheat Elliott Wave Analysis," "market trends," and "Elliott Wave theory," this content optimizes visibility across search engines, facilitating accessibility for traders and investors seeking informed analyses. Through a comprehensive exploration of Wheat's price dynamics and trajectory projections, this analytical discourse equips stakeholders with invaluable insights essential for strategic decision-making and capitalizing on emerging opportunities within the commodities market. Stay informed, stay ahead with Wheat Elliott Wave Analysis.
Technical Analyst: Sanmi Adeagbo
Source: visit Tradinglounge.com and learn From the Experts Join TradingLounge Here
See Previous: Silver (XAGUSD)
TradingLounge Once Off SPECIAL DEAL: Here > 1 month Get 3 months.