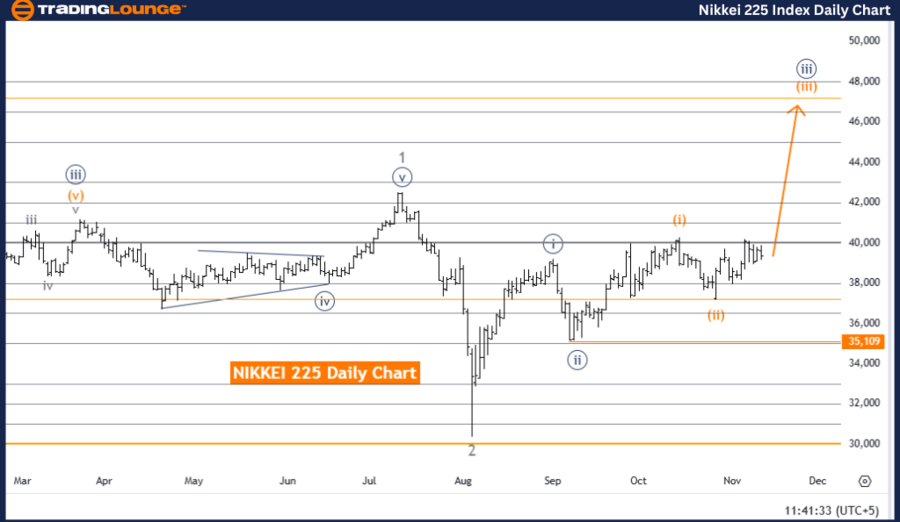
NIKKEI 225 (N225) Elliott Wave Analysis Trading Lounge Day Chart

NIKKEI 225 (N225) Elliott Wave Technical Analysis

Function: Bullish Trend

Mode: Impulsive

Structure: Orange Wave 3

Position: Navy Blue Wave 3

Direction Next Higher Degrees: Orange Wave 3 (Started)

Details: Orange Wave 2 appears completed; Orange Wave 3 is now active.

Wave Cancel Invalidation Level: 35,109

The NIKKEI 225 Elliott Wave analysis on the daily chart reflects a bullish trend driven by an impulsive wave pattern. The primary focus is on Orange Wave 3, signaling a positive market outlook as it unfolds within the Navy Blue Wave 3 structure.

Wave Structure and Key Insights

  • The completion of Orange Wave 2 confirms the activation of Orange Wave 3, aligning with a strong upward trajectory.
  • Orange Wave 3 is typically associated with significant price movement in the direction of the prevailing trend.

Invalidation Level

  • An invalidation level has been identified at 35,109.
  • A decline to or below this threshold would invalidate the progression of Orange Wave 3, suggesting the need to reassess the wave framework and potentially signaling a trend shift.

Summary

The current analysis projects a bullish outlook for the NIKKEI 225, with Orange Wave 3 driving the impulsive wave structure within Navy Blue Wave 3. Traders should monitor price levels closely, especially around the 35,109 invalidation level, as a breach could indicate a reversal or correction.

NIKKEI-225-1d-index-...


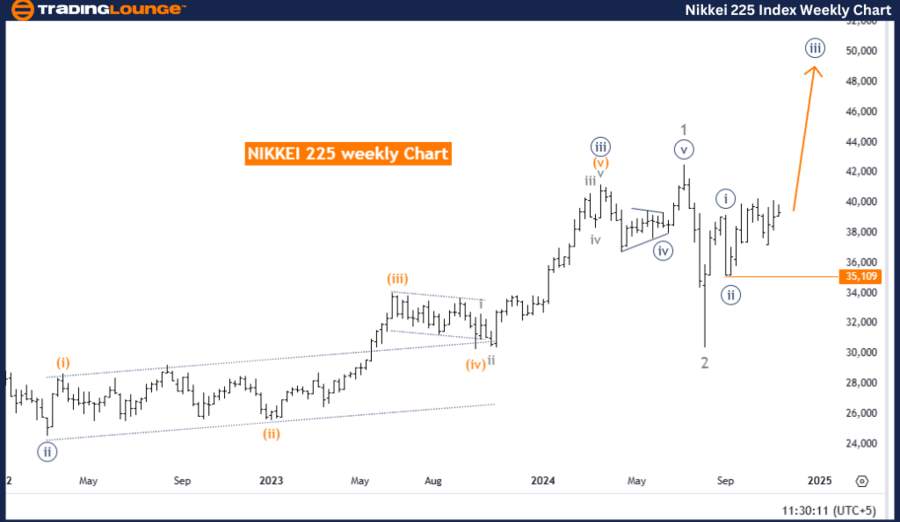
NIKKEI 225 (N225) Elliott Wave Analysis Trading Lounge Weekly Chart

NIKKEI 225 (N225) Elliott Wave Technical Analysis

Function: Bullish Trend

Mode: Impulsive

Structure: Navy Blue Wave 3

Position: Gray Wave 3

Direction Next Higher Degrees: Navy Blue Wave 3 (Continuing)

Details: Navy Blue Wave 2 appears completed; Navy Blue Wave 3 is now active.

Wave Cancel Invalidation Level: 35,109

The weekly analysis of the NIKKEI 225 underscores a bullish trajectory, emphasizing the progression of Navy Blue Wave 3 within Gray Wave 3. This impulsive wave pattern reinforces a sustained upward movement, reflecting positive sentiment and long-term growth potential.

Wave Structure and Key Insights

  • The completion of Navy Blue Wave 2 has led to the activation of Navy Blue Wave 3, an essential phase within the Elliott Wave framework.
  • Wave 3 is often characterized by the strongest and most extensive price movement, affirming a robust upward trend in the NIKKEI 225.

Invalidation Level

  • The invalidation level for this wave structure is set at 35,109.
  • A drop to or below this level could interrupt the progression of Navy Blue Wave 3, signaling a shift in sentiment or the start of a corrective phase.

Summary

The NIKKEI 225 continues to display a bullish outlook, with Navy Blue Wave 3 driving the impulsive trend within Gray Wave 3. Traders should pay close attention to the 35,109 invalidation level, as any breach may indicate a disruption in the bullish framework, requiring a reassessment of market dynamics.

Technical Analyst: Malik Awais

Source: visit Tradinglounge.com and learn From the Experts Join TradingLounge Here 

Previous: RUSSELL 2000 Elliott Wave Technical Analysis 

VALUE Offer - Buy 1 Month & Get 3 Months!Click here

Access 7 Analysts Over 200 Markets Covered. Chat Room With Support

NIKKEI-225-weekly-in...

Related

BTCUSD Elliott Wave Analysis: Bitcoin Eyes $118K Target as Wave 5 Ends – Technical Forecast & Trading Strategy Explained

BTCUSD Elliott Wave Analysis: Bitcoin Eyes $118K Target as Wave 5 Ends – Technical Forecast & Trading Strategy Explained

Bitcoin is advancing through its final wave ⑤, aiming for a $118,187 Fibonacci target. Traders shou...

Read More >
Costco Wholesale Corp.(COST:NASDAQ) Elliott Wave Technical Analysis 10 January 24

Costco Wholesale Corp.(COST:NASDAQ) Elliott Wave Technical Analysis 10 January 24

Costco Wholesale Corp.(COST: NASDAQ) Elliott Wave Technical Analysis Dated 10 January 24 with 4-Hour...

Read More >
Unlocking ASX Trading Success: MINERAL RESOURCES LIMITED - MIN Stock Analysis & Elliott Wave Technical Forecast

Unlocking ASX Trading Success: MINERAL RESOURCES LIMITED - MIN Stock Analysis & Elliott Wave Technical Forecast

This detailed analysis provides an in-depth look at the Elliott Wave patterns influencing MINERAL RE...

Read More >
Bovespa Index Elliott Wave Technical Analysis Reveals Bullish Trend with Active Impulsive Wave 3 in Brazil's Stock Market

Bovespa Index Elliott Wave Technical Analysis Reveals Bullish Trend with Active Impulsive Wave 3 in Brazil's Stock Market

The Bovespa Index is exhibiting a strong bullish trend, currently progressing through Orange Wave 3 ...

Read More >
Elliott Wave Analysis of AMD Stock: Price Predictions, Resistance at $200, Support Near $120, and Market Trends

Elliott Wave Analysis of AMD Stock: Price Predictions, Resistance at $200, Support Near $120, and Market Trends

This analysis explores AMD’s Elliott Wave patterns, highlighting corrective wave structures, price ...

Read More >
 Forex USD/JPY Currency Pair and U.S. Dollar/Japanese Yen (USDJPY) Forex Elliott Wave Technical Analysis

Forex USD/JPY Currency Pair and U.S. Dollar/Japanese Yen (USDJPY) Forex Elliott Wave Technical Analysis

Gain in-depth USD/JPY Elliott Wave analysis knowledge with our comprehensive guide. Learn about curr...

Read More >

$1 for 2 Weeks

then $29 a month!

What a Special Offer!

Trade Recommendations

Unleash the power of deversified trading with our comprehensive portfolio, covering 250+ markets:

  • Stock Trades
  • Crypto Trades
  • Forex Trades
  • Commodity Trades
Elliott Wave Analysis

Gain a competitive edge with expert insights and AI-powered Elliott Wave charting into:

  • Global Indices
  • US Stocks & ASX Stocks
  • Forex & Crypto
  • Commodities
Top-Notch Trading Tools

Equip yourself with the tools of success:

  • Real-time Chat rooms
  • Elliott Wave Algorithm
  • Portfolio tools
  • TradingLevels
  • Screener
  • Trading Game
7 Elliott Wave Analysts

Stay ahead of the market with daily charts and insightful videos
Your secret to strategic trading!

JOIN HERE


Welcome to TradingLounge (ASIC A.R.No. 321187), specialists in trades, trading education and technical analysis, covering stocks, indices, commodities, forex and cryptocurrencies.

When you join TradingLounge you have access to everything we offer, including trade tools, educational content and a social platform to chat with like-minded investors.

Read more

@Copyright 2024 by tradinglounge.com

Contact Us

Australian no: 02 4787 6020

International no: +61 (2) 47876020

Pay with:

Find us on