TradingLounge LARSEN & TOUBRO – LT Elliott Wave Analysis (1D Chart)
LT Elliott Wave Technical Analysis
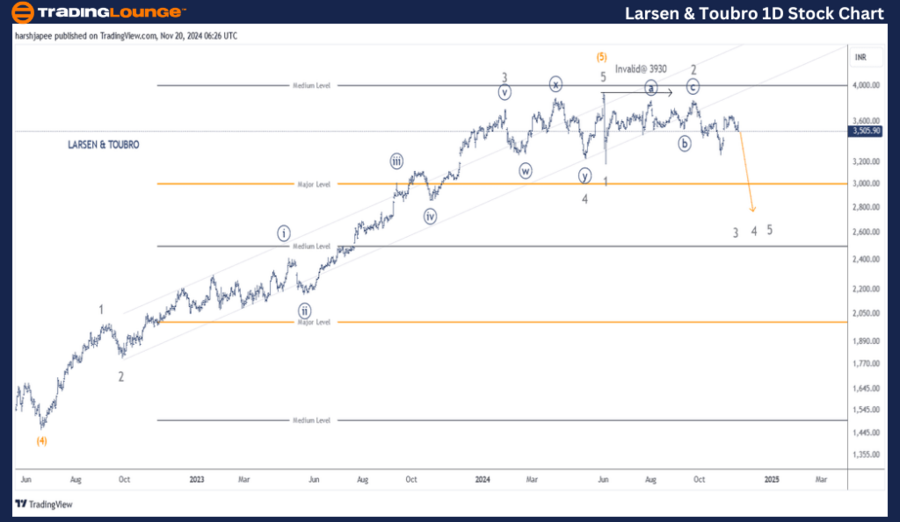
Function: Counter Trend (Intermediate degree, orange)
Mode: Corrective
Structure: Impulse, within larger degree Wave (A)
Position: Minor Wave 3 Grey
Details: Minor Wave 3 Grey continues to progress lower, maintaining resistance at 3930. Further extensions downward are possible.
Invalidation Point: 3930
Daily Chart Technical Analysis and Elliott Wave Insights
The LARSEN & TOUBRO (LT) daily chart reveals that the larger degree uptrend concluded near the 3930 peak, with prices potentially reversing lower. A corrective structure at a Minor degree is likely unfolding, and only a breakout above 3930 will invalidate this bearish outlook.
Previously, the stock completed Intermediate Wave (4) Orange around the 1475 lows in January 2022. The subsequent rally subdivided into five waves—Minor Waves 1 through 5—culminating at the 3930 level. Notably, Wave 2 exhibited sharp characteristics, while Wave 4 unfolded as a combination pattern.
Currently, the market seems to be in a counter-trend correction against the 3930 high, indicating a bearish sentiment that may persist.
LARSEN & TOUBRO – LT (4H Chart) Elliott Wave Technical Analysis
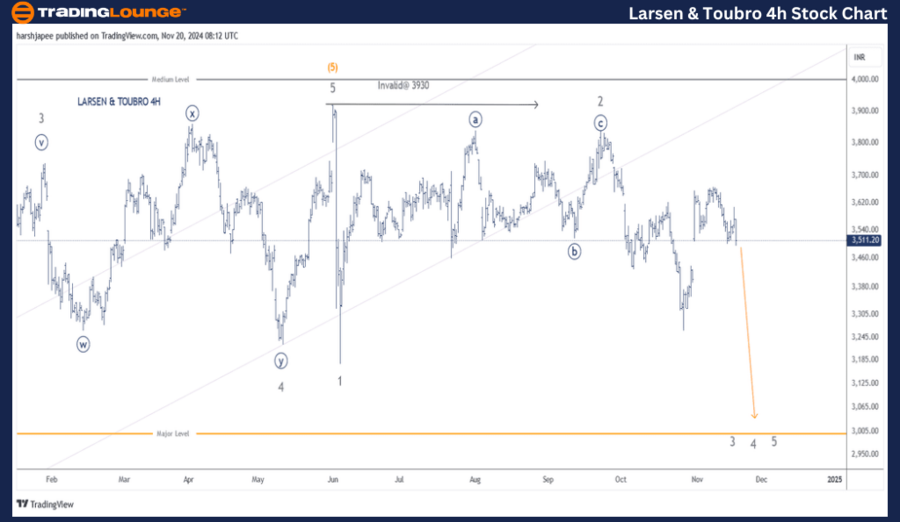
Function: Counter Trend (Intermediate degree, orange)
Mode: Corrective
Structure: Impulse, within larger degree Wave (A)
Position: Minor Wave 3 Grey
Details: Minor Wave 3 Grey is extending lower, targeting a break below 3270, which could accelerate the downtrend. Resistance remains firm at 3930.
Invalidation Point: 3930
4H Chart Technical Analysis and Elliott Wave Insights
The LARSEN & TOUBRO (LT) 4-hour chart emphasizes the sub-wave structure following the completion of Minor Wave 3 Grey near the 3740–3745 zone. Minor Wave 4 unfolded as a combination pattern ((w))-((x))-((y)), concluding near the 3230 level.
Subsequently, Minor Wave 5 Grey emerged as an impulse, rallying to the 3930 high before reversing sharply and breaking below 3230 to complete Minor Wave 1 Grey. The corrective Wave 2 likely terminated as a flat near the 3845 level. If this structure holds, Wave 3 appears to be underway, with resistance marked at the 3845 high.
Technical Analyst: Harsh Japee
Source: visit Tradinglounge.com and learn From the Experts Join TradingLounge Here
Previous: GRASIM INDUSTRIES Elliott Wave Technical Analysis
VALUE Offer - Buy 1 Month & Get 3 Months!Click here
Access 7 Analysts Over 200 Markets Covered. Chat Room With Support
Conclusion
LARSEN & TOUBRO (LT) shows signs of continued bearish progression, with prices heading towards the 3150 level in the near term. To maintain the bearish Elliott Wave structure, prices must stay below the 3930 high.