NASDAQ Elliott Wave Analysis – Trading Lounge Day Chart
NASDAQ Elliott Wave Technical Analysis
Function: Counter Trend
Mode: Impulsive as Wave C
Structure: Gray Wave C
Position: Orange Wave 4
Direction (Next Higher Degrees): Orange Wave 5
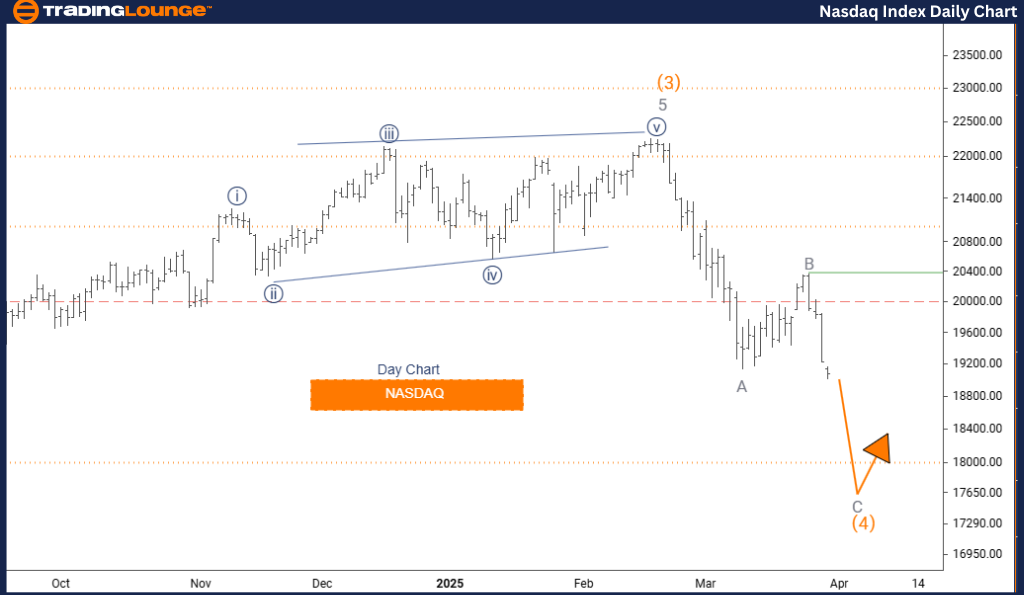
Details: Gray Wave B appears completed; now, Gray Wave C of 4 is active
Daily Chart Overview:
The NASDAQ daily Elliott Wave analysis currently reflects a counter-trend scenario with upward potential. This ongoing market behavior features a complex correction, where Gray Wave C is progressing within the wider Orange Wave 4 correction. Based on wave analysis, Gray Wave B has concluded, initiating the active phase of Gray Wave C of 4. This stage implies that the market may be advancing into the closing part of a larger correction before resuming its long-term bullish trend.
Wave Structure Insight:
This counter-trend setup displays impulsive characteristics that are typical for Wave C in corrective phases. The daily time frame is ideal for viewing the wave development, helping traders pinpoint the NASDAQ’s current position in the larger Elliott Wave cycle. Upon the completion of Gray Wave C of Orange Wave 4, the market is expected to shift into Orange Wave 5, an impulsive wave signaling a likely continuation of the upward trend.
Technical Note:
The analysis emphasizes the importance of wave degree alignment, placing Gray Wave C as a significant short-term component of the ongoing Orange Wave 4 correction. Traders are advised to monitor the formation of the typical five-wave structure within Gray Wave C, often marking the end of a corrective phase. Confirmation of the wave pattern is essential before taking any strategic positions in the NASDAQ market.
NASDAQ Elliott Wave Analysis – Trading Lounge Weekly Chart
NASDAQ Elliott Wave Technical Analysis
Function: Counter Trend
Mode: Corrective
Structure: Orange Wave 4
Position: Navy Blue Wave 1
Direction (Next Higher Degrees): Orange Wave 5
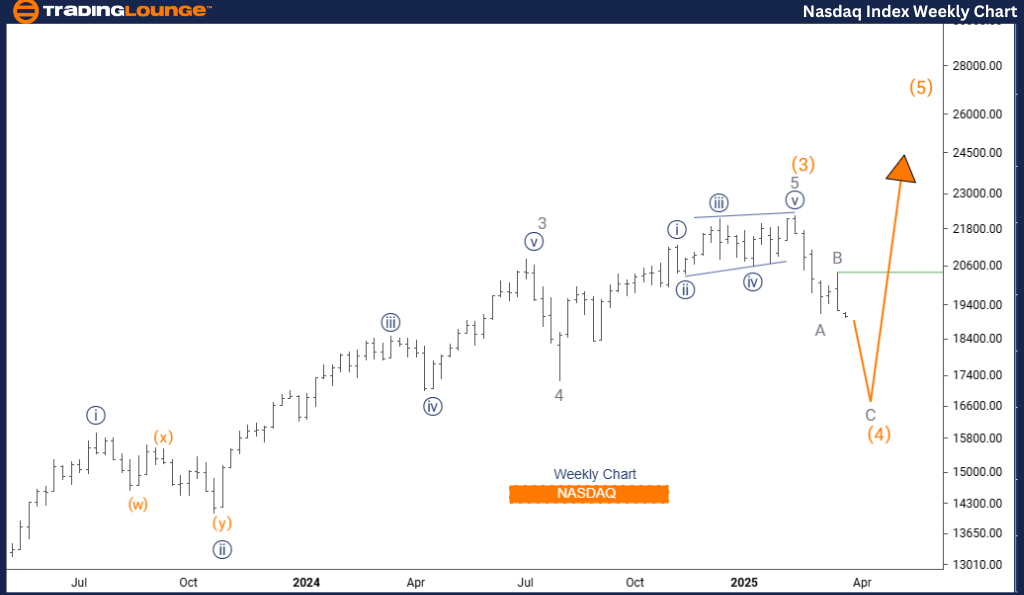
Details: Orange Wave 3 appears complete; Orange Wave 4 is now active
Weekly Chart Overview:
The weekly NASDAQ Elliott Wave forecast shows the index in a corrective phase, specifically identified as Orange Wave 4, following the completion of Orange Wave 3. This ongoing movement suggests a temporary counter-trend correction, serving as a pullback before the broader market trend resumes.
Wave Structure Insight:
The development of Orange Wave 4 aligns with the natural wave cycle within Elliott Wave theory. The presence of Navy Blue Wave 1 gives further clarity on the broader trend direction. As this correction unfolds, it is laying the foundation for the next major phase—Orange Wave 5, anticipated to carry the market in a bullish direction.
Technical Note:
This analysis gives traders a clear perspective on both the present and projected wave movements in the NASDAQ index. Understanding the wave count helps anticipate shifts in market sentiment and guides better trading strategies. As Orange Wave 4 nears completion, an impulsive rally under Orange Wave 5 is expected to begin, supporting the continuation of the prevailing upward momentum.
Technical Analyst: Malik Awais
Source: visit Tradinglounge.com and learn From the Experts Join TradingLounge Here
Previous: S&P/TSX 60 Elliott Wave Technical Analysis
VALUE Offer - Buy 1 Month & Get 3 Months!Click here
Access 7 Analysts Over 200 Markets Covered. Chat Room With Support
Conclusion:
The NASDAQ index is currently positioned within Orange Wave 4, a corrective stage. Upon its completion, a transition to Orange Wave 5 is expected, suggesting a potential upward breakout. Utilizing Elliott Wave analysis enables traders to better interpret market phases and enhance trading decisions by identifying structured wave patterns.