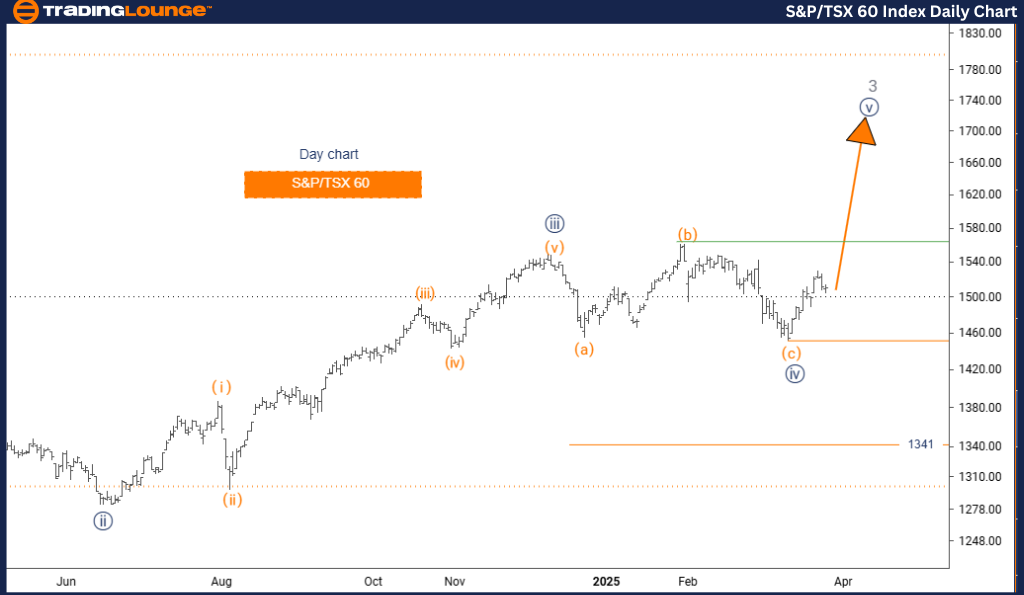
S&P/TSX 60 Elliott Wave Analysis – TradingLounge Day Chart
S&P/TSX 60 Elliott Wave Technical Analysis
Function: Bullish Trend
Mode: Impulsive
Structure: Navy Blue Wave 5
Position: Gray Wave 3
Direction (Next Lower Degrees): Gray Wave 4
Invalidation Level: 1341
Technical Overview:
The daily Elliott Wave forecast for the S&P/TSX 60 index indicates a prevailing bullish trend. Focus remains on navy blue wave 5, which is actively progressing within the broader gray wave 3 structure. The prior correction in navy blue wave 4 appears complete, signaling the continuation of upward momentum in wave 5.
This setup highlights that the index is approaching the culmination of a significant bullish sequence initiated from gray wave 1. The key invalidation level is identified at 1341. A drop below this point would invalidate the current wave count and trigger a reassessment of the bullish outlook.
Market Context:
The daily chart reflects a detailed Elliott Wave count, emphasizing the final impulsive advance. After completion of navy blue wave 5, a corrective move in gray wave 4 is anticipated, setting the stage for the potential continuation of gray wave 5.
Navy blue wave 5 presents both a trading opportunity and a structural end-phase of the bullish cycle. Traders should remain alert for classic fifth wave characteristics such as weakening momentum or bearish divergence, often indicative of an upcoming correction.
Strategic Implications:
The uptrend persists, and maintaining long positions aligns with this analysis. However, as wave 5 unfolds, implementing stricter risk control measures is advised to manage exposure during potential trend reversals.
This analysis delivers valuable insights for traders aiming to capitalize on the final phase of the current bullish movement in the S&P/TSX 60 index.
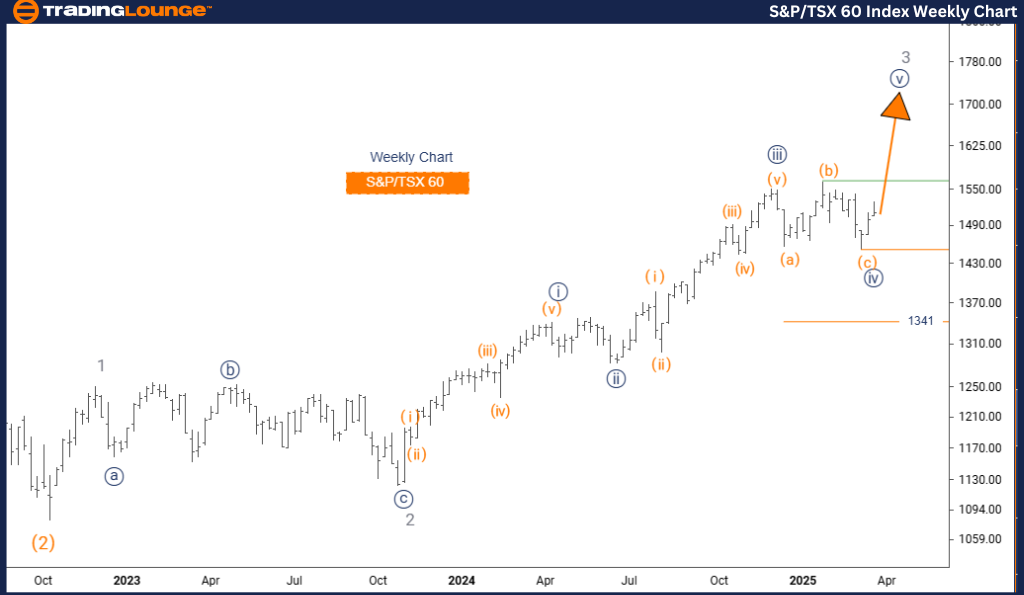
S&P/TSX 60 Elliott Wave Analysis – TradingLounge Weekly Chart
S&P/TSX 60 Elliott Wave Technical Analysis
Function: Bullish Trend
Mode: Impulsive
Structure: Navy Blue Wave 5
Position: Gray Wave 3
Direction (Next Lower Degrees): Gray Wave 4
Invalidation Level: 1341
Technical Overview:
The weekly Elliott Wave analysis of the S&P/TSX 60 index maintains a strong bullish projection, pointing to the final stages of a major impulsive sequence. Currently, navy blue wave 5 is advancing as a component of the broader gray wave 3 structure. With navy blue wave 4 confirmed as complete, the market is entering the terminal phase of the impulse.
This scenario suggests the index is nearing the end of a large-scale upward trend that began with gray wave 1. The critical invalidation level at 1341 remains a key reference—any decline beneath this level invalidates the current count.
Market Context:
The weekly chart outlines the wave progression clearly, showing navy blue wave 5 within gray wave 3. Following this move, a corrective wave (gray wave 4) is expected before the potential resumption of the bullish trend in gray wave 5.
Wave 5 formations often precede significant shifts. Traders should monitor for momentum slowdown and volume divergence—common signs indicating trend exhaustion at wave cycle completion.
Strategic Implications:
Remaining in long positions is consistent with the current bullish configuration. However, traders should be cautious as wave 5 matures. Adjusting risk strategies is prudent to account for possible trend fatigue.
This weekly Elliott Wave update provides actionable intelligence for position traders targeting gains from the potential final phase of the S&P/TSX 60 index bullish cycle.
Technical Analyst: Malik Awais
Source: visit Tradinglounge.com and learn From the Experts Join TradingLounge Here
Previous: IBEX 35 (Spain) Elliott Wave Technical Analysis
VALUE Offer - Buy 1 Month & Get 3 Months!Click here
Access 7 Analysts Over 200 Markets Covered. Chat Room With Support