GRASIM INDUSTRIES – GRASIM Elliott Wave Analysis (1D Chart)

GRASIM Elliott Wave Technical Analysis

Function: Counter Trend Lower (Minor Degree Grey)

Mode: Corrective

Structure: Potential Zigzag

Position: Still unfolding, not labeled yet

Details:

  • A potential Minor degree zigzag may be forming against the key resistance at 2880.

  • Near-term projections suggest a pullback toward the 2600-2620 range before a continuation lower.

Invalidation Point: 2880

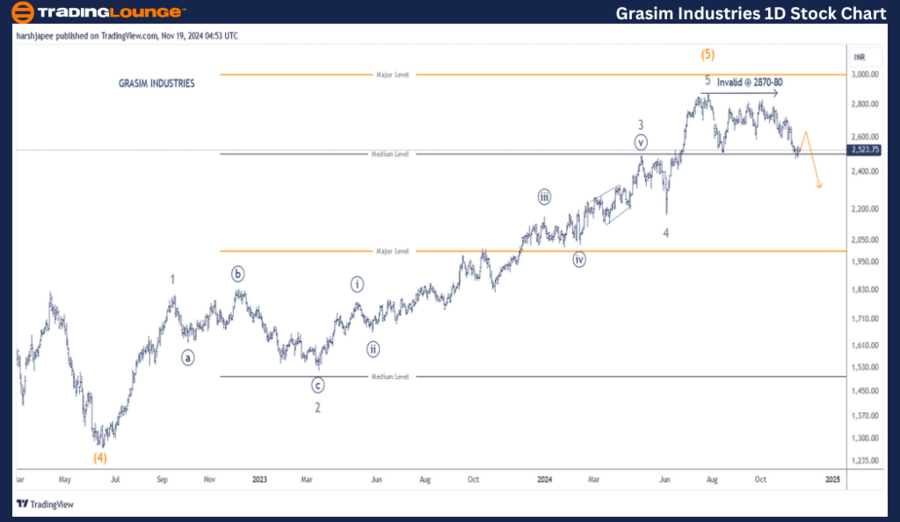
GRASIM INDUSTRIES Daily Chart Technical Analysis and Potential Elliott Wave Counts

The daily chart of GRASIM INDUSTRIES suggests the larger degree (Intermediate) uptrend might have reached its termination point near the 2880 level. The stock appears to be in the early stages of forming a larger degree corrective wave. The medium-term target aligns with a move toward the 2170 support level.

Key Observations:

  • Intermediate Wave (4) concluded near 1270 in June 2022.

  • The subsequent rally subdivides into five waves (Minor 1 through 5) culminating at the 2880 level.

  • If accurate, this setup indicates a bearish inclination to initiate a corrective wave of a larger degree, with a downside target of approximately 2170.

GRASIM-INDUSTRIES-1D...


GRASIM INDUSTRIES Elliott Wave Technical Analysis (4H Chart)

Function: Counter Trend Lower (Minor Degree Grey)

Mode: Corrective

Structure: Potential Zigzag

Position: Minute ((ii)) Grey on the 4H chart

Details:

  • A Minor degree zigzag may be unfolding against the 2880 resistance.

  • Minute Wave ((i)) and ((ii)) appear to have completed on the 4H chart, potentially forming Minor Wave A of the projected zigzag pattern.

  • Short-term projections suggest a pullback toward the 2600-2620 range before the next move lower.

Invalidation Point: 2880

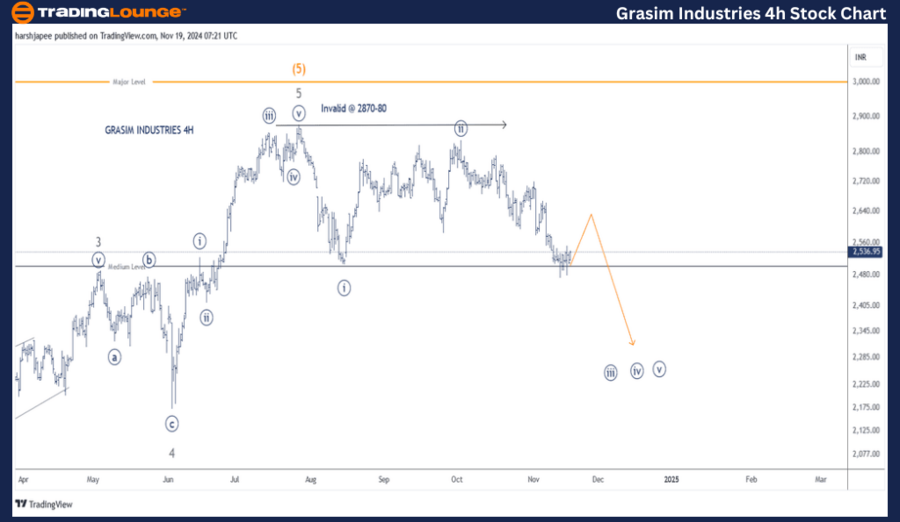
GRASIM INDUSTRIES 4H Chart Technical Analysis and Potential Elliott Wave Counts

The 4H chart of GRASIM INDUSTRIES shows:

  • Termination of Minor Wave 3 Grey near the 2510-2520 range.
  • Minor Wave 4 formed a sharp zigzag, followed by an impulsive move completing Minor Wave 5 of (5) near 2880.
  • Minute Waves ((i)) and ((ii)) potentially concluded around 2500 and 2835, respectively, though these are yet to be marked on the daily chart.
  • If the analysis is accurate, Minute Wave ((iii)) could now be progressing with resistance at 2880.

Technical Analyst: Harsh Japee

Source: visit Tradinglounge.com and learn From the Experts Join TradingLounge Here 

Previous: ASIAN PAINTS Elliott Wave Technical Analysis

VALUE Offer - Buy 1 Month & Get 3 Months!Click here

Access 7 Analysts Over 200 Markets Covered. Chat Room With Support

GRASIM-INDUSTRIES-4h...


Conclusion

GRASIM INDUSTRIES may have concluded Intermediate Wave (5) Orange near 2880. The stock is likely in the process of initiating a larger corrective wave. Key downside targets include the 2600-2620 range in the short term and 2170 in the medium term.

Related

RIO Tinto Limited Elliott Wave analysis: ASX RIO Stock Movements by Evaluating Wave Structures and Price Action

RIO Tinto Limited Elliott Wave analysis: ASX RIO Stock Movements by Evaluating Wave Structures and Price Action

Our latest Elliott Wave analysis on ASX: RIO Tinto (RIO) reveals a bullish outlook, with the stock d...

Read More >
Most Accurate Silver Price Forecast Using Detailed Elliott Wave analysis: Silver (XAGUSD) Commodity Market Outlook

Most Accurate Silver Price Forecast Using Detailed Elliott Wave analysis: Silver (XAGUSD) Commodity Market Outlook

Stay updated with the most accurate Silver price forecast using detailed Elliott Wave analysis. This...

Read More >
Swiss Market Index Elliott Wave Technical Analysis: Key Insights for Daily and Weekly Chart Trends

Swiss Market Index Elliott Wave Technical Analysis: Key Insights for Daily and Weekly Chart Trends

The Swiss Market Index (SMI) Elliott Wave Analysis provides a detailed look at current market trends...

Read More >
Providing Forecasts for the British Pound to U.S. Dollar Currency Pair: GBPUSD Forex Elliott Wave Technical Analysis

Providing Forecasts for the British Pound to U.S. Dollar Currency Pair: GBPUSD Forex Elliott Wave Technical Analysis

Our detailed GBPUSD Elliott Wave analysis covers daily and 4-hour chart evaluations, providing forec...

Read More >
Elliott Wave Analysis for NASDAQ 100 & Key Stocks: Expert Insights & Trading Strategies

Elliott Wave Analysis for NASDAQ 100 & Key Stocks: Expert Insights & Trading Strategies

Dive into our latest Elliott Wave Analysis for the NASDAQ 100, including detailed insights and tradi...

Read More >
Netflix Inc. (NFLX) Elliott Wave Technical Analysis: Netflix Stock Forecast, Wave 3 Progression, Wave 4 Pullback

Netflix Inc. (NFLX) Elliott Wave Technical Analysis: Netflix Stock Forecast, Wave 3 Progression, Wave 4 Pullback

NFLX Elliott Wave Analysis: We break down Netflix stock's technical structure using daily and on...

Read More >

Buy 1 Month

Get 3 Months!

Special Offer:

Trade Recommendations

Unleash the power of deversified trading with our comprehensive portfolio, covering:

  • Stock Trades
  • Crypto Trades
  • Forex Trades
  • Commodity Trades
Elliott Wave Analysis

Gain a competive edge with expert insights in to:

  • Global Indices
  • US Stocks & ASX Stocks
  • Forex & Crypto
  • Commodities
Top-Notch Trading Tools

Equip yourself with the tools of success:

  • Social Chat
  • Elliott Wave Algorithm
  • Screener
  • TradingLevels
  • Trading Game
7 Elliott Wave Analysts

Stay ahead of the market with daily charts and insightful videos
-Your secret to strategic trading!

JOIN HERE


Welcome to TradingLounge (ASIC A.R.No. 321187), specialists in trades, trading education and technical analysis, covering stocks, indices, commodities, forex and cryptocurrencies.

When you join TradingLounge you have access to everything we offer, including trade tools, educational content and a social platform to chat with like-minded investors.

Read more

@Copyright 2024 by tradinglounge.com

Contact Us

Australian no: 02 4787 6020

International no: +61 (2) 47876020

Pay with:

Find us on