ASIAN PAINTS Elliott Wave Analysis - TradingLounge Day Chart
ASIAN PAINTS Elliott Wave Technical Analysis
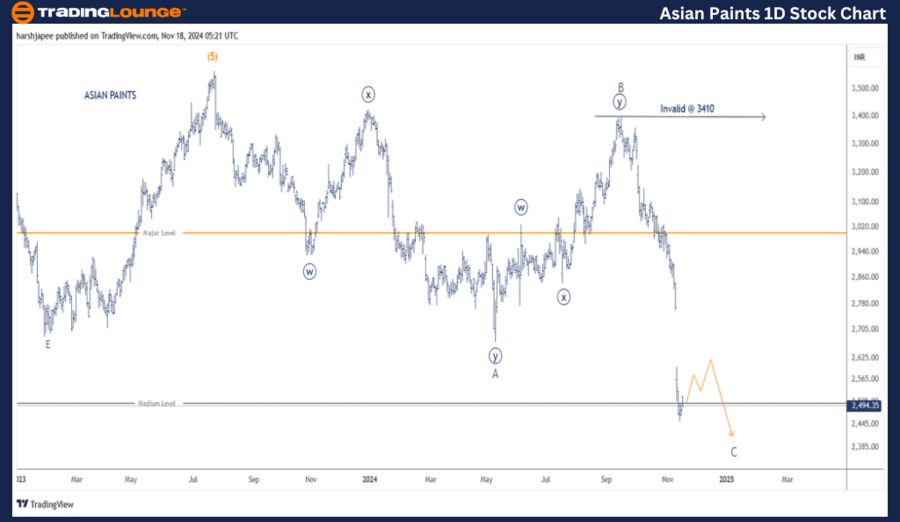
Function: Counter Trend Lower (Minor Degree Grey)
Mode: Corrective
Structure: Flat (3-3-5)
Position: Minute Wave C
Details: A Minor degree corrective wave A-B-C is unfolding against the 3550 level, with Waves A and B already in place. The high-probability count indicates Minute Wave C is either complete or near completion.
Invalidation point: 3410
ASIAN PAINTS Daily Chart Technical Analysis and Potential Elliott Wave Counts:
If this scenario holds, bullish momentum could return soon, lifting the stock from current levels.
ASIAN PAINTS Elliott Wave Analysis - TradingLounge 4H Chart
ASIAN PAINTS Elliott Wave Technical Analysis
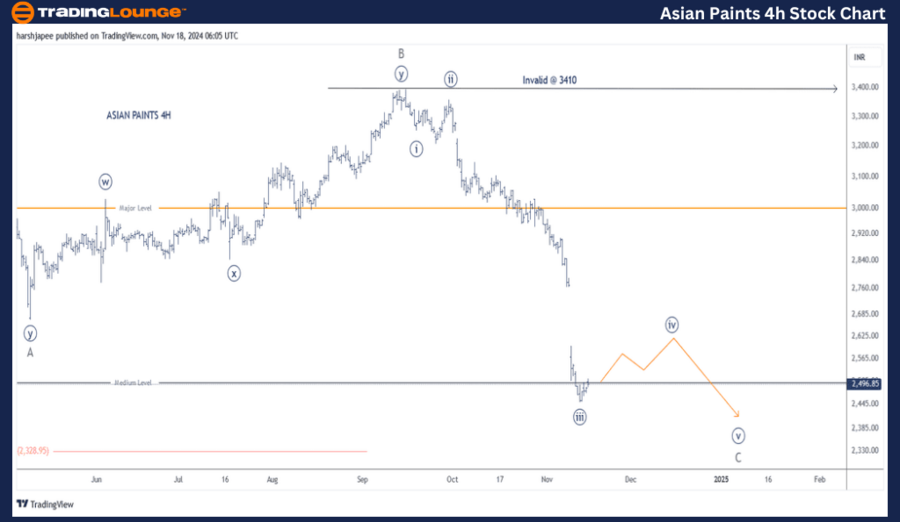
Function: Counter Trend Lower (Minor Degree Grey)
Mode: Corrective
Structure: Flat (3-3-5)
Position: Minute Wave C
Details: A Minor degree corrective A-B-C wave is progressing against the 3550 resistance, with Waves A and B complete. A high-probability count shows Minute Wave C is close to finishing.
Minute Wave ((iii)) Navy within C may have extended, leading to a potential Wave ((iv)) correction before a final low to terminate Minor Wave C.
Invalidation point: 3410
ASIAN PAINTS 4H Chart Technical Analysis and Potential Elliott Wave Counts:
Technical Analyst: Harsh Japee
Source: visit Tradinglounge.com and learn From the Experts Join TradingLounge Here
Previous: ADANI GREEN ENERGY Elliott Wave Technical Analysis
VALUE Offer - Buy 1 Month & Get 3 Months!Click here
Access 7 Analysts Over 200 Markets Covered. Chat Room With Support
Conclusion: