ASX: WOODSIDE ENERGY GROUP LTD - WDS Elliott Wave Analysis 1D Chart

Greetings! In this Elliott Wave analysis update, we delve into the Australian Stock Exchange (ASX) with a focus on WOODSIDE ENERGY GROUP LTD (ASX: WDS). Our observations suggest that ASX: WDS may be in the process of unfolding a wave ((iii))-navy, indicating the potential for upward movement. A break above the 27.20 level would further validate this analysis.

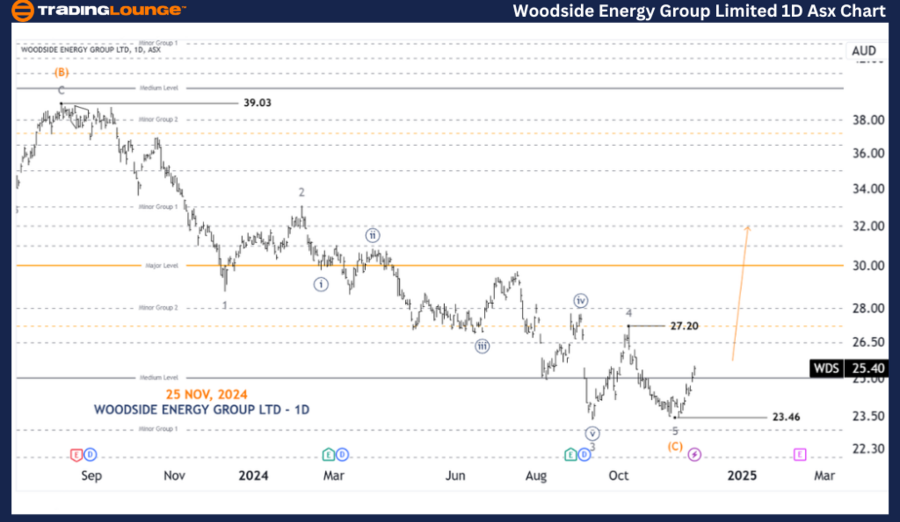
ASX: WOODSIDE ENERGY GROUP LTD - WDS 1D Chart (Semilog Scale) Analysis

WDS Elliott Wave Technical Analysis

Function: Major Trend (Primary Degree, Navy)

Mode: Motive

Structure: Impulse

Position: Wave ((3))-navy

Details:
Our analysis shows signs that wave ((2))-navy may have completed, and wave ((3))-navy is likely in progress. A confirmed push above the 27.20 level would reinforce this outlook.

Invalidation Point: 23.46

WOODSIDE-ENERGY-GROU...


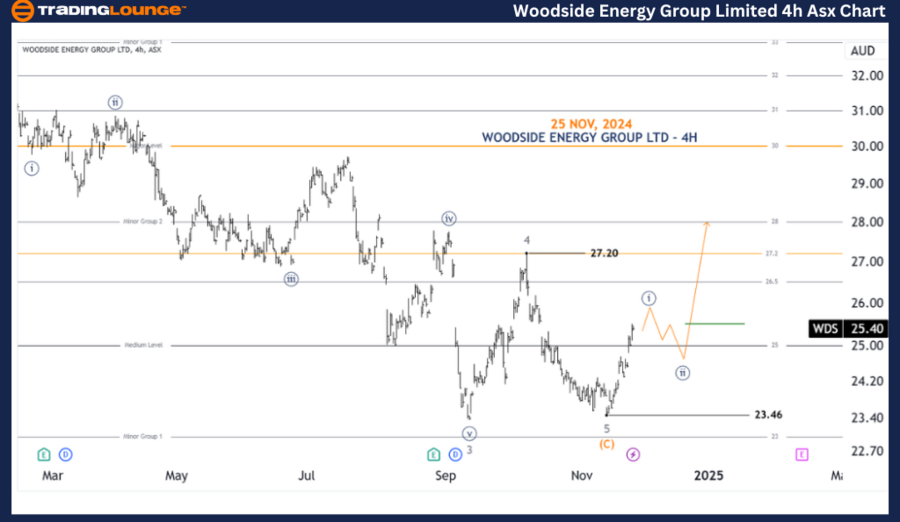
ASX: WOODSIDE ENERGY GROUP LTD - WDS 4-Hour Chart Analysis

Function: Major Trend (Minuette Degree, Navy)

Mode: Motive

Structure: Impulse

Position: Wave ((i))-navy

Details:
From the recent low at 23.46, the chart displays a probable five-wave structure that can be identified as wave ((i))-navy. This suggests the potential for further upward movement before a pullback in wave ((ii))-navy. Upon completion of this pullback, a renewed upward push is expected.

To capitalize on this setup, traders could look to Go Long after the price pulls back and then moves above the wave B level of wave ((ii))-navy. The 25.00 level would then act as a medium-term support level, strengthening the potential for a quality long position.

Invalidation Point: 23.46

Technical Analyst: Hua (Shane) Cuong, CEWA-M (Master’s Designation).

Source: visit Tradinglounge.com and learn From the Experts Join TradingLounge Here 

See Previous: WESFARMERS LIMITED – WES Elliott Wave Technical Analysis

VALUE Offer - Buy 1 Month & Get 3 Months!Click here

Access 7 Analysts Over 200 Markets Covered. Chat Room With Support

WOODSIDE-ENERGY-GROU...


Conclusion

Our analysis of ASX: WOODSIDE ENERGY GROUP LTD - WDS offers insights into both contextual market trends and short-term trading opportunities. By highlighting specific price levels such as 27.20 (validation) and 23.46 (invalidation), we aim to provide a structured and objective perspective on the current wave count. These levels allow traders to better assess the reliability of the forecast and act accordingly. Combining technical insights with actionable strategies, we aim to empower readers to navigate market movements effectively.

Related

Costco Wholesale Corp. (COST) Stocks Elliott Wave Technical Analysis: Price Predictions and Strategic Trading Insights

Costco Wholesale Corp. (COST) Stocks Elliott Wave Technical Analysis: Price Predictions and Strategic Trading Insights

This article provides an in-depth Elliott Wave analysis of Costco Wholesale Corp. (COST) stock. It c...

Read More >
IBEX 35 (Spain) Index Elliott Wave Technical Analysis: Reveals key insights into the current market trends

IBEX 35 (Spain) Index Elliott Wave Technical Analysis: Reveals key insights into the current market trends

The IBEX 35's Elliott Wave analysis reveals key insights into the current market trends. On the ...

Read More >
CAC 40 Elliott Wave Technical Analysis: Discover the Best Strategies for Trading the France Index, Get Forecasts, and Stay Updated

CAC 40 Elliott Wave Technical Analysis: Discover the Best Strategies for Trading the France Index, Get Forecasts, and Stay Updated

This detailed CAC 40 analysis uses Elliott Wave analysis to provide insights into current market tre...

Read More >
Detailed insights into Nvidia Corp.(NVDA) Stocks Elliott Wave Technical Analysis Covering daily and 4-hour charts

Detailed insights into Nvidia Corp.(NVDA) Stocks Elliott Wave Technical Analysis Covering daily and 4-hour charts

This article provides an in-depth NVDA Elliott Wave Analysis for Nvidia Corp., covering daily and 4-...

Read More >
Stock Market Analysis: Costco Wholesale Corp.(COST) Elliott Wave Technical Analysis

Stock Market Analysis: Costco Wholesale Corp.(COST) Elliott Wave Technical Analysis

Delve into comprehensive Elliott Wave analysis for Costco Wholesale Corp. (COST), uncovering intrica...

Read More >

$1 for 2 Weeks

then $29 a month!

What a Special Offer!

Trade Recommendations

Unleash the power of deversified trading with our comprehensive portfolio, covering 250+ markets:

  • Stock Trades
  • Crypto Trades
  • Forex Trades
  • Commodity Trades
Elliott Wave Analysis

Gain a competitive edge with expert insights and AI-powered Elliott Wave charting into:

  • Global Indices
  • US Stocks & ASX Stocks
  • Forex & Crypto
  • Commodities
Top-Notch Trading Tools

Equip yourself with the tools of success:

  • Real-time Chat rooms
  • Elliott Wave Algorithm
  • Portfolio tools
  • TradingLevels
  • Screener
  • Trading Game
7 Elliott Wave Analysts

Stay ahead of the market with daily charts and insightful videos
Your secret to strategic trading!

JOIN HERE


Welcome to TradingLounge (ASIC A.R.No. 321187), specialists in trades, trading education and technical analysis, covering stocks, indices, commodities, forex and cryptocurrencies.

When you join TradingLounge you have access to everything we offer, including trade tools, educational content and a social platform to chat with like-minded investors.

Read more

@Copyright 2024 by tradinglounge.com

Contact Us

Australian no: 02 4787 6020

International no: +61 (2) 47876020

Pay with:

Find us on