15Nov

Technical Analysis of Adani Green Energy Stock with Elliott Wave Insights: Understand Share Price and Trends Movements

ADANI GREEN ENERGY – TradingLounge Day Chart Analysis

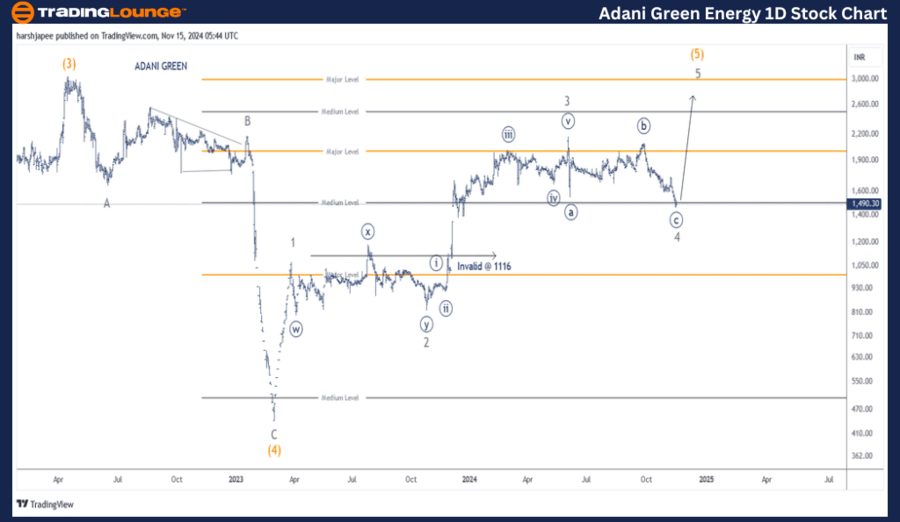
ADANIGREEN (1D Chart) Elliott Wave Technical Analysis

Function: Larger Degree Trend Higher (Intermediate degree, orange)

Mode: Motive

Structure: Impulse

Position: Minor Wave 4 Grey

Details:

  • The counts have been revised with a potential conclusion of Minor Wave 4 Grey in the 1485-90 zone.
  • If this interpretation holds, Minor Wave 5 Grey may resume its upward trend shortly, completing Intermediate Wave (5).
  • Alternatively, a prolonged decline would suggest a larger degree correction is in progress.

Invalidation point: 1116

ADANI GREEN ENERGY Daily Chart Technical Analysis and Elliott Wave Counts

The daily chart for ADANI GREEN ENERGY suggests a steady rally, potentially entering the final phase of Minor Wave 5 Grey within Intermediate Wave (5) Orange. Current levels are supported at 1480, with a key invalidation threshold at 1116.

  • Immediate Resistance: 1750 – A breakout above this level could confirm a bottom formation.
  • Intermediate Wave (4) Orange concluded around 435 in February 2023.
  • The rally has since traversed:
    • Minor Wave 1: 1075
    • Minor Wave 2: 824
    • Minor Wave 3: 2170
    • Potential Minor Wave 4: 1480

Projection:
If the above wave structure holds, bullish momentum is likely to resume soon from the current price of 1490 as Minor Wave 5 unfolds.

ADANI-GREEN-ENERGY-1...


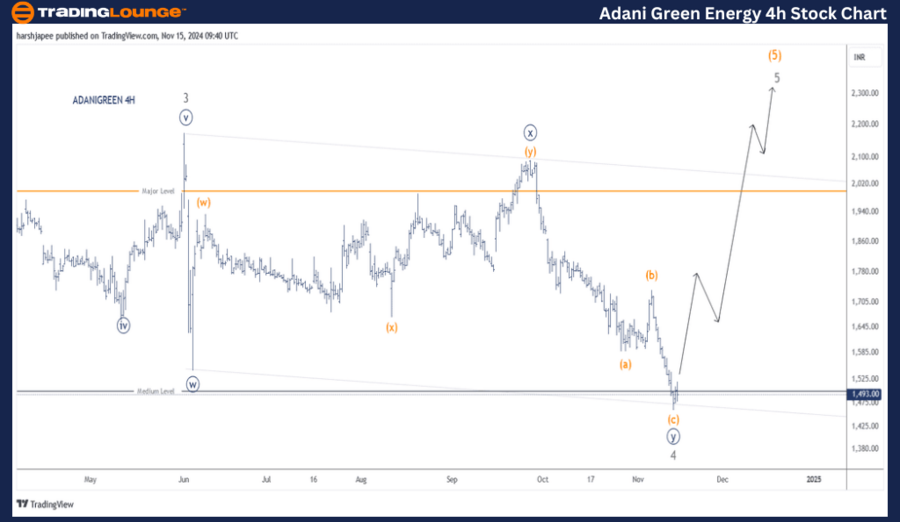
ADANI GREEN ENERGY – TradingLounge 4-hour Chart Analysis

ADANI GREEN ENERGY Elliott Wave Technical Analysis

Function: Larger Degree Trend Higher (Intermediate degree, orange)

Mode: Motive

Structure: Impulse

Position: Minor Wave 4 Grey

Details:

  • The wave counts indicate a possible end to Minor Wave 4 Grey near the 1485-90 range.

  • A continuation above 1735 would signal that bulls are back in control, confirming the onset of Minor Wave 5 Grey within Intermediate Wave (5).
  • A failure to hold above the current support could imply a more significant correction.

Invalidation point: 1116

ADANI GREEN ENERGY 4H Chart Technical Analysis and Elliott Wave Counts

The 4H chart emphasizes the sub-wave patterns between Minor Wave 3 and Minor Wave 4.

  • The Minute Wave structure has been adjusted to a corrective ((w))-((x))-((y)) pattern, appearing to have completed near the 1480-90 range.
  • Channel support has been successfully tested at these levels.

Projection:
If the wave count is correct, the stock is expected to trend higher, sustaining above the 1480 low.

Technical Analyst: Harsh Japee

Source: visit Tradinglounge.com and learn From the Experts Join TradingLounge Here 

Previous: STATE BANK OF INDIA – SBIN Elliott Wave Technical Analysis

VALUE Offer - Buy 1 Month & Get 3 Months!Click here

Access 7 Analysts Over 200 Markets Covered. Chat Room With Support

ADANI-GREEN-ENERGY-4...


Conclusion

ADANI GREEN ENERGY is positioned for a potential upward rally from the current price of 1490 as Minor Wave 5 unfolds within Intermediate Wave (5) Orange. A break above 1750 would solidify bullish momentum and confirm the end of the corrective phase.

Related

Elliott Wave Analysis of AAVE (AAVEUSD): Downtrend Continuation, Support and Resistance Levels for Crypto Swing Traders

Elliott Wave Analysis of AAVE (AAVEUSD): Downtrend Continuation, Support and Resistance Levels for Crypto Swing Traders

Elliott Wave analysis examines AAVE/USD price trends, identifying a downtrend continuation within a ...

Read More >
COLES GROUP LIMITED (ASX:COL) Elliott Wave Analysis, Stock Forecast, and Investment Strategy for Informed Trading Decisions

COLES GROUP LIMITED (ASX:COL) Elliott Wave Analysis, Stock Forecast, and Investment Strategy for Informed Trading Decisions

COLES GROUP LIMITED (ASX:COL) Elliott Wave technical analysis offers valuable insights into stock tr...

Read More >
Copper Commodity Market Analysis with Accurate Predictions and Trading Strategies Using Elliott Wave Technical Analysis

Copper Commodity Market Analysis with Accurate Predictions and Trading Strategies Using Elliott Wave Technical Analysis

Get insights into the latest Copper Elliott Wave analysis, covering key price forecasts, technical a...

Read More >
Elliott Wave Techniacl Analysis for Berkshire Hathaway Inc. (BRK:B): Daily and 1-Hour Chart Insights to Predict Stock Price Movements

Elliott Wave Techniacl Analysis for Berkshire Hathaway Inc. (BRK:B): Daily and 1-Hour Chart Insights to Predict Stock Price Movements

Elliott Wave analysis examines the daily and 1-hour charts of Berkshire Hathaway (BRK.B) and Visa In...

Read More >
ASX Aristocrat Leisure Limited Elliott Wave Technical Forecast: Price Predictions, Trends and Trading Strategies for ASX: ALL

ASX Aristocrat Leisure Limited Elliott Wave Technical Forecast: Price Predictions, Trends and Trading Strategies for ASX: ALL

Gain actionable insights with our Elliott Wave analysis for ASX Aristocrat Leisure Limited (ALL). Ex...

Read More >
U.S.Dollar/Japanese Yen(USDJPY) Forex Elliott Wave Technical Analysis: Impulsive Trends and Key Levels to Watch

U.S.Dollar/Japanese Yen(USDJPY) Forex Elliott Wave Technical Analysis: Impulsive Trends and Key Levels to Watch

Elliott Wave analysis of the USDJPY currency pair highlights the current trend, explains the impulsi...

Read More >

$1 for 2 Weeks

then $29 a month!

What a Special Offer!

Trade Recommendations

Unleash the power of deversified trading with our comprehensive portfolio, covering 250+ markets:

  • Stock Trades
  • Crypto Trades
  • Forex Trades
  • Commodity Trades
Elliott Wave Analysis

Gain a competitive edge with expert insights and AI-powered Elliott Wave charting into:

  • Global Indices
  • US Stocks & ASX Stocks
  • Forex & Crypto
  • Commodities
Top-Notch Trading Tools

Equip yourself with the tools of success:

  • Real-time Chat rooms
  • Elliott Wave Algorithm
  • Portfolio tools
  • TradingLevels
  • Screener
  • Trading Game
7 Elliott Wave Analysts

Stay ahead of the market with daily charts and insightful videos
Your secret to strategic trading!

JOIN HERE


Welcome to TradingLounge (ASIC A.R.No. 321187), specialists in trades, trading education and technical analysis, covering stocks, indices, commodities, forex and cryptocurrencies.

When you join TradingLounge you have access to everything we offer, including trade tools, educational content and a social platform to chat with like-minded investors.

Read more

@Copyright 2024 by tradinglounge.com

Contact Us

Australian no: 02 4787 6020

International no: +61 (2) 47876020

Pay with:

Find us on