14Nov

State Bank of India (SBIN) Stock Analysis: Elliott Wave Technical Insights and Price Predictions

STATE BANK OF INDIA – SBIN (1D Chart) Elliott Wave Technical Analysis

 SBIN Elliott Wave Technical Analysis

Function: Counter Trend (Minor degree, Grey)

Mode: Motive

Structure: Impulse within larger degree zigzag

Position: Minor Wave 2

Details:
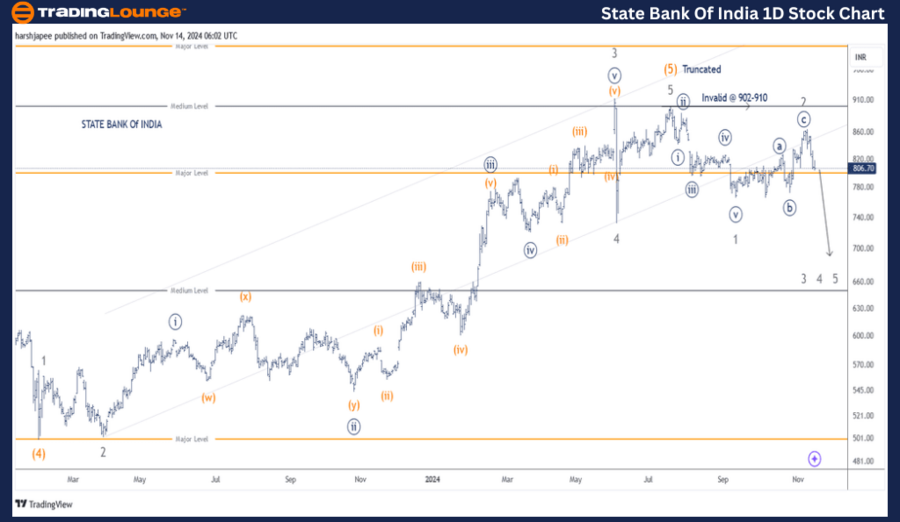
Minor Wave 2 Grey may have extended to the 860 zone. If this analysis holds true, Wave 3 could be underway soon.

Invalidation Point: 910

State Bank of India Daily Chart Technical Analysis and Potential Elliott Wave Counts

The daily chart of State Bank of India signals a potential trend reversal after reaching the 920 high, marking Intermediate Wave (5) Orange. This truncation was followed by an impulsive decline to 765, completing Minor Wave 1. Subsequently, a counter-trend rally led to the 860 high, suggesting the end of Wave 2.

If this structure remains valid, bearish momentum is likely to dominate as Wave 3 unfolds. The critical invalidation level for the bearish scenario is 920. Furthermore, a breakdown below 730 could accelerate the downward move. Alternatively, a breakout above 920 would confirm a bullish reversal.

STATE-BANK-OF-INDIA-...


STATE BANK OF INDIA – SBIN (4H Chart) Elliott Wave Technical Analysis

Function: Counter Trend (Minor degree, Grey)

Mode: Motive

Structure: Impulse within larger degree zigzag

Position: Minor Wave 2

Details:
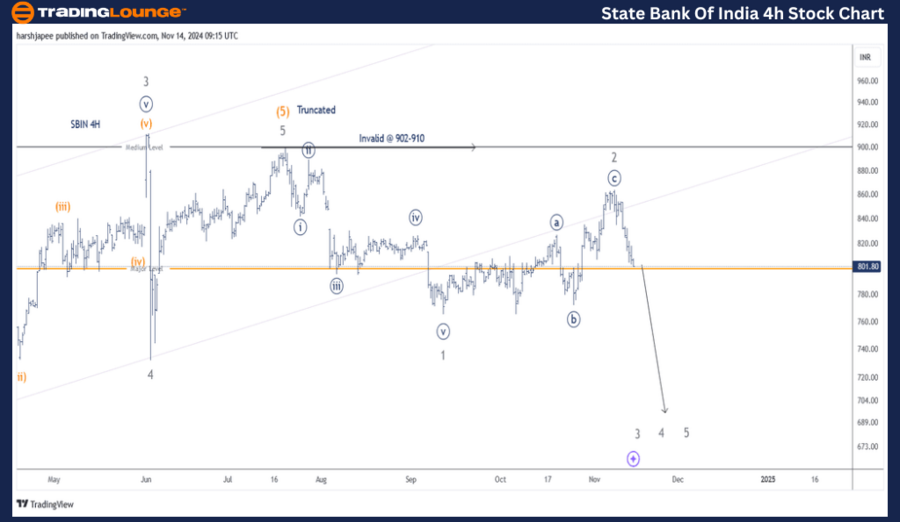
Minor Wave 2 Grey may have extended to the 860 level. If correct, Wave 3 could now be underway. As of writing, the stock trades around 803, with bearish pressure likely to push prices further down.

Invalidation Point: 910

State Bank of India 4H Chart Technical Analysis and Potential Elliott Wave Counts

The 4-hour chart of State Bank of India reflects the wave structure following the completion of Minor Wave 4 near the 730 level on June 4, 2024. Minor Wave 5 appears to have been truncated, ending around the 910 level.

An impulsive decline followed, completing Minor Wave 1 Grey, succeeded by a corrective rally (Minor Wave 2 Grey) that ended near 860. Assuming this structure is accurate, the ongoing price action represents Minor Wave 3, which could extend below the 700 mark.

Technical Analyst: Harsh Japee

Source: visit Tradinglounge.com and learn From the Experts Join TradingLounge Here 

Previous: JSW STEEL Elliott Wave Technical Analysis  

VALUE Offer - Buy 1 Month & Get 3 Months!Click here

Access 7 Analysts Over 200 Markets Covered. Chat Room With Support

STATE-BANK-OF-INDIA-...


Conclusion

State Bank of India appears to be moving lower within Wave 3, with a projected target near the 700 level, while 920 serves as the critical invalidation point for this bearish scenario.

Related

Microsoft Corp (MSFT:NASDAQ) Elliott Wave Technical Analysis 20 November 23

Microsoft Corp (MSFT:NASDAQ) Elliott Wave Technical Analysis 20 November 23

Trading Lounge Microsoft Corp.(MSFT: NASDAQ) Elliott Wave Technical Analysis on 20 November 23, MSFT...

Read More >
Australian Dollar/Japanese Yen(AUDJPY) Elliott Wave Technical Analysis 17 January 24

Australian Dollar/Japanese Yen(AUDJPY) Elliott Wave Technical Analysis 17 January 24

In summary, the AUDJPY Elliott Wave Analysis for the daily chart on 17 January 24, suggests that the...

Read More >
Enhance your Forex Trading Strategies With New Zealand Dollar/U.S. Dollar (NZDUSD) Forex Elliott Wave Technical Analysis

Enhance your Forex Trading Strategies With New Zealand Dollar/U.S. Dollar (NZDUSD) Forex Elliott Wave Technical Analysis

Our detailed Elliott Wave analysis gives a comprehensive understanding of the NZDUSD currency pair. ...

Read More >
U.S. Dollar / Swiss Franc (USDCHF) Elliott Wave Forecast: Daily and 4H Charts with Key Support and Resistance Analysis

U.S. Dollar / Swiss Franc (USDCHF) Elliott Wave Forecast: Daily and 4H Charts with Key Support and Resistance Analysis

USDCHF shows a bearish Elliott Wave structure with wave 3 unfolding, signaling further downside. Dai...

Read More >
NIFTY 50 Elliott Wave Analysis: Market Forecast, Key Levels, Trading Strategy & Price Prediction Daily & 4H Chart Insights

NIFTY 50 Elliott Wave Analysis: Market Forecast, Key Levels, Trading Strategy & Price Prediction Daily & 4H Chart Insights

The NIFTY 50 INDEX is currently in a corrective wave structure, approaching the 22,000 - 22,100 zone...

Read More >
S&P/TSX 60 Elliott Wave Analysis: Orange Wave 4 Corrective Phase, Wave Predictions, Bullish Trends, and Market Insights

S&P/TSX 60 Elliott Wave Analysis: Orange Wave 4 Corrective Phase, Wave Predictions, Bullish Trends, and Market Insights

Gain valuable insights into the S&P/TSX 60 Index with a thorough Elliott Wave analysis. Explore the ...

Read More >

Buy 1 Month

Get 3 Months!

Special Offer:

Trade Recommendations

Unleash the power of deversified trading with our comprehensive portfolio, covering:

  • Stock Trades
  • Crypto Trades
  • Forex Trades
  • Commodity Trades
Elliott Wave Analysis

Gain a competive edge with expert insights in to:

  • Global Indices
  • US Stocks & ASX Stocks
  • Forex & Crypto
  • Commodities
Top-Notch Trading Tools

Equip yourself with the tools of success:

  • Social Chat
  • Elliott Wave Algorithm
  • Screener
  • TradingLevels
  • Trading Game
7 Elliott Wave Analysts

Stay ahead of the market with daily charts and insightful videos
-Your secret to strategic trading!

JOIN HERE


Welcome to TradingLounge (ASIC A.R.No. 321187), specialists in trades, trading education and technical analysis, covering stocks, indices, commodities, forex and cryptocurrencies.

When you join TradingLounge you have access to everything we offer, including trade tools, educational content and a social platform to chat with like-minded investors.

Read more

@Copyright 2024 by tradinglounge.com

Contact Us

Australian no: 02 4787 6020

International no: +61 (2) 47876020

Pay with:

Find us on