JSW STEEL Stock Analysis - TradingLounge  (1D Chart)

JSW STEEL Stock 1D Chart Analysis

JSWSTEEL Elliott Wave Technical Analysis

Function: Counter Trend (Minor Degree Grey)

Mode: Corrective

Structure: Potential impulse within a larger degree correction

Position: Minute Degree is still unfolding

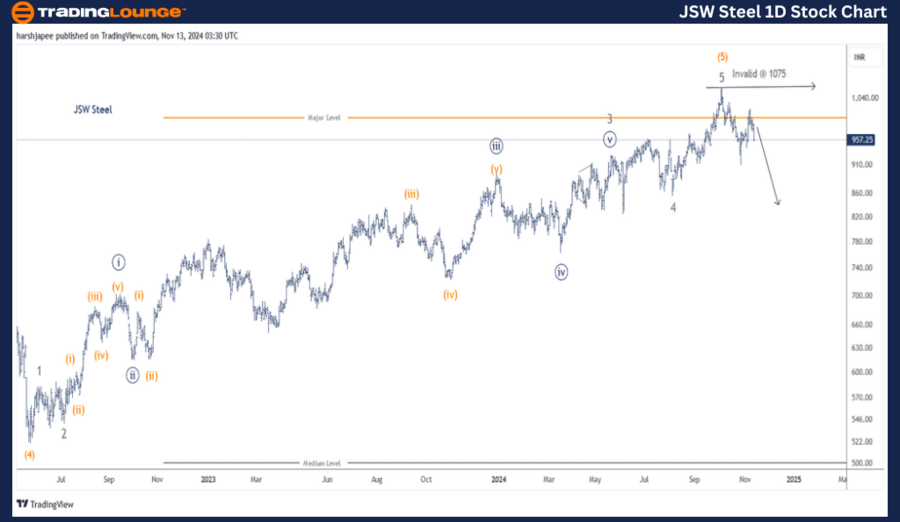
Details: The proposed wave structure has shifted as the stock moved below the 960 mark. Minor Wave 4 Grey has been adjusted, with Wave 5 potentially completing near 1075. A push beyond 1075 will likely reestablish bullish momentum.

Invalidation Point: 1075

JSW STEEL Daily Chart Analysis and Elliott Wave Counts

The JSW STEEL daily chart signals a larger degree trend, terminating at the 1075 high. Intermediate Wave (5) Orange is complete, with prices declining toward the 850 mark at a Minor Degree. At the time of writing, the stock trades around 932.

Key observations:

  • Intermediate Wave (4) Orange concluded around 520 in May 2022.
  • The subsequent rally subdivides into five waves, labeled Minor Wave 1 through 5, visible on the daily chart.
  • Although not explicitly labeled yet, a larger degree correction against the 1075 high is underway.
JSW-Steel-1D-Stock-C...


JSW STEEL Stock Analysis - TradingLounge  (4H Chart)

JSW STEEL Stock 4-hour Chart Analysis

JSW STEEL – JSWSTEEL Technical Analysis

Function: Counter Trend (Minor Degree Grey)

Mode: Corrective

Structure: Potential impulse within a larger degree correction

Position: Minute Degree is still unfolding

Details:

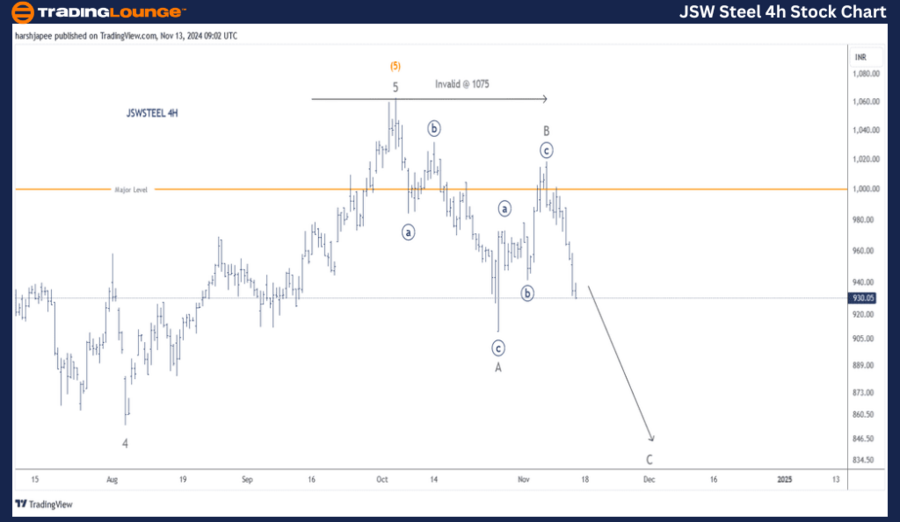
The wave structure has shifted following a drop below 960. Minor Wave 4 Grey was adjusted, with Wave 5 likely completing near 1075. Bulls could regain control with a breakout above 1075. A potential corrective A-B-C pattern is visible, with Wave C seemingly progressing downward.

Invalidation Point: 1075

JSW STEEL 4H Chart Analysis and Elliott Wave Counts

The JSW STEEL 4H chart reflects adjusted wave counts after Minor Wave 4 concluded near 855 in August 2024. The decline from the 1075 high may represent a Minor Degree A-B-C correction or a more complex pattern. Bears currently dominate, targeting the 850 mark. Any changes to this count will be addressed in the next update.

Technical Analyst: Harsh Japee

Source: visit Tradinglounge.com and learn From the Experts Join TradingLounge Here 

Previous: EICHER MOTORS Elliott Wave Technical Analysis 

VALUE Offer - Buy 1 Month & Get 3 Months!Click here

Access 7 Analysts Over 200 Markets Covered. Chat Room With Support
JSW-Steel-4h-Stock-C...


Conclusion:

JSW STEEL is undergoing a corrective decline at a Minor Degree, retracing from the 1075 high.

Related

Natural Gas Commodity Elliott Wave Technical Analysis Predicts a Continuation of the Bearish Trend in 2024 and Offers Insights

Natural Gas Commodity Elliott Wave Technical Analysis Predicts a Continuation of the Bearish Trend in 2024 and Offers Insights

This article provides a detailed analysis of the natural gas market using Elliott Wave theory. It co...

Read More >
Britannia Industries Stock Forecast & Elliott Wave Technical Analysis – Price Targets & Trading Strategies

Britannia Industries Stock Forecast & Elliott Wave Technical Analysis – Price Targets & Trading Strategies

Britannia Industries has shown promising momentum with bullish patterns reflected through Elliott Wa...

Read More >
NVIDIA Corp. (NVDA) Stocks Elliott Wave Technical Analysis Includes NVDA's Wave Counts, Potential Targets, and Resistance Levels

NVIDIA Corp. (NVDA) Stocks Elliott Wave Technical Analysis Includes NVDA's Wave Counts, Potential Targets, and Resistance Levels

This article offers a comprehensive analysis of NVIDIA Corp. (NVDA) using Elliott Wave Theory. We de...

Read More >
Polkadot/U.S. dollar(DOTUSD) Elliott Wave Technical Analysis 1 February 24

Polkadot/U.S. dollar(DOTUSD) Elliott Wave Technical Analysis 1 February 24

TradingLounge Polkadot technical analysis today using Polkadot/US dollar(DOTUSD) Elliott Wave Analys...

Read More >
Polkadot Crypto Price News Today Elliott Wave Technical Analysis: Price Trends, Key Levels, and Trading Insights

Polkadot Crypto Price News Today Elliott Wave Technical Analysis: Price Trends, Key Levels, and Trading Insights

Get a comprehensive DOT/USD Elliott Wave analysis, including technical insights and price forecasts....

Read More >
Day and 4-hour Chart for British Pound/U.S.Dollar (GBPUSD) Elliott Wave Technical Analysis

Day and 4-hour Chart for British Pound/U.S.Dollar (GBPUSD) Elliott Wave Technical Analysis

Our GBP/USD Elliott Wave Analysis for the 4-hour chart on 13 March 24 suggests an ongoing impulsive ...

Read More >

Buy 1 Month

Get 3 Months!

Special Offer:

Trade Recommendations

Unleash the power of deversified trading with our comprehensive portfolio, covering:

  • Stock Trades
  • Crypto Trades
  • Forex Trades
  • Commodity Trades
Elliott Wave Analysis

Gain a competive edge with expert insights in to:

  • Global Indices
  • US Stocks & ASX Stocks
  • Forex & Crypto
  • Commodities
Top-Notch Trading Tools

Equip yourself with the tools of success:

  • Social Chat
  • Elliott Wave Algorithm
  • Screener
  • TradingLevels
  • Trading Game
7 Elliott Wave Analysts

Stay ahead of the market with daily charts and insightful videos
-Your secret to strategic trading!

JOIN HERE


Welcome to TradingLounge (ASIC A.R.No. 321187), specialists in trades, trading education and technical analysis, covering stocks, indices, commodities, forex and cryptocurrencies.

When you join TradingLounge you have access to everything we offer, including trade tools, educational content and a social platform to chat with like-minded investors.

Read more

@Copyright 2024 by tradinglounge.com

Contact Us

Australian no: 02 4787 6020

International no: +61 (2) 47876020

Pay with:

Find us on