23Nov

Visa Inc.(V:NYSE) Elliott Wave Technical Analysis 23 November 23

Visa Inc., Elliott Wave Technical Analysis

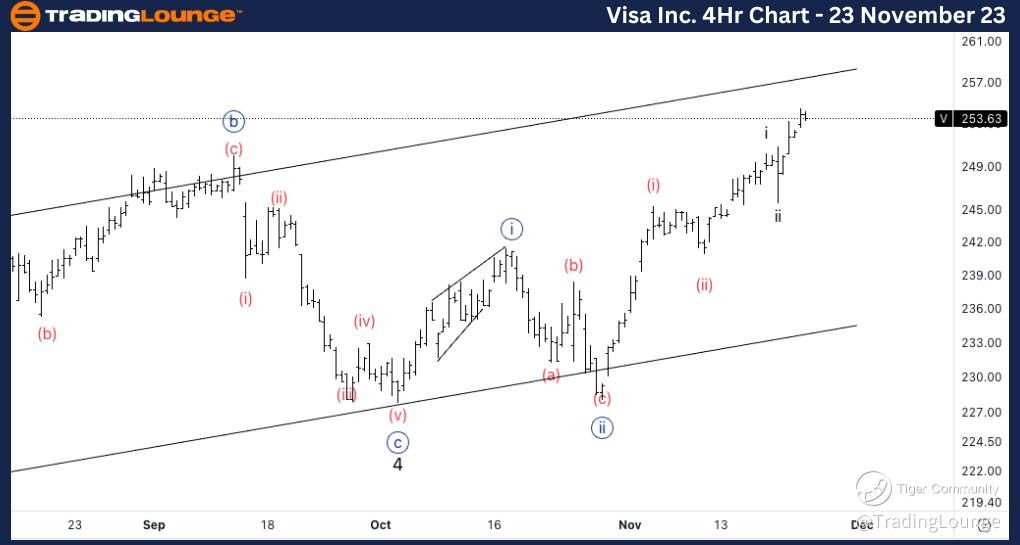
Visa Inc., (V:NYSE): 4h Chart 23 November 23

V Stock Market Analysis:  We have been bullish n Visa for a while now, we have been finding support on 250$ and we are looking forward to continuing seeing it acting as support. If the count is correct we should expect the next upside target to be 280$.  

V Elliott Wave Count: Wave iii of (iii).

V Technical Indicators: Above all averages.

V Trading Strategy: Looking for longs into wave (iii).  

TradingLounge Analyst: Alessio Barretta

Source: Tradinglounge.com get trial here!

Visa-Inc-4Hr-Stock-C...


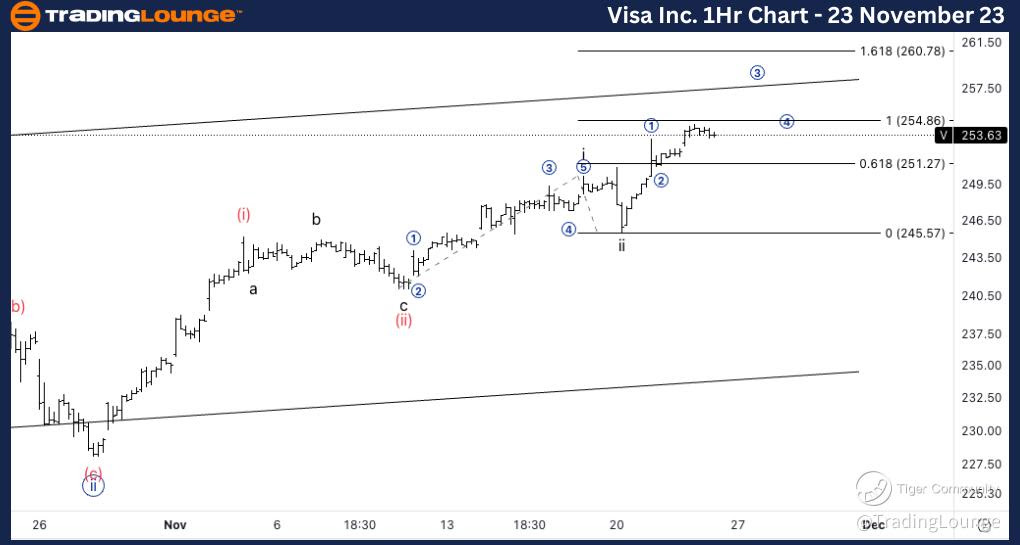
Visa Inc.,  V: 1-hour Chart 23 November 23

Visa Inc., Elliott Wave Technical Analysis 

V Stock Market Analysis: We are looking for upside into wave iii of (iii), therefore we should expect an acceleration higher. We are looking for 253$ to be supported and to then continue higher into Minor Group 2.  

V Elliott Wave count:  Wave 3 of iii. s

V Technical Indicators: Above all averages.

V Trading Strategy: Looking for longs if 253$ is tested support.

Visa-Inc-1Hr-Stock-C...

Related

Learn About the ASX WBC Share Price Forecasts, and Technical Chart Updates For Westpac Banking Corporation Elliott Wave Analysis

Learn About the ASX WBC Share Price Forecasts, and Technical Chart Updates For Westpac Banking Corporation Elliott Wave Analysis

Our detailed Elliott Wave analysis will give valuable insights into ASX: Westpac Banking Corporation...

Read More >
Stay ahead with our forecast ASX Stock Analysis & Asx Limited Elliott Wave Technical Forecast

Stay ahead with our forecast ASX Stock Analysis & Asx Limited Elliott Wave Technical Forecast

Our detailed ASX Elliott Wave analysis provides expert technical insights into ASX LIMITED stock. Le...

Read More >
Navigating Stock Market Indices with Elliott Wave Analysis: SP500, NASDAQ 100, RUSSELL 2000, and More

Navigating Stock Market Indices with Elliott Wave Analysis: SP500, NASDAQ 100, RUSSELL 2000, and More

This blog explores the current state of major stock market indices, including the S&P 500, NASDAQ 10...

Read More >
Soybean Price Analysis: SoyBeans Elliott Wave Technical Analysis, Signals Recovery Amidst Potential Sell-Off

Soybean Price Analysis: SoyBeans Elliott Wave Technical Analysis, Signals Recovery Amidst Potential Sell-Off

Amidst a recent recovery in Soybean prices, Elliott wave analysis reveals a complex picture hinting ...

Read More >
Valuable Forex Trading Insights for Australian Dollar/U.S. Dollar Currency Pair with AUDUSD Elliott Wave Technical Analysis

Valuable Forex Trading Insights for Australian Dollar/U.S. Dollar Currency Pair with AUDUSD Elliott Wave Technical Analysis

Gain valuable insights into the AUDUSD market with our in-depth Elliott Wave Analysis. Learn about t...

Read More >

Buy 1 Month

Get 3 Months!

Special Offer:

Trade Recommendations

Unleash the power of deversified trading with our comprehensive portfolio, covering:

  • Stock Trades
  • Crypto Trades
  • Forex Trades
  • Commodity Trades
Elliott Wave Analysis

Gain a competive edge with expert insights in to:

  • Global Indices
  • US Stocks & ASX Stocks
  • Forex & Crypto
  • Commodities
Top-Notch Trading Tools

Equip yourself with the tools of success:

  • Social Chat
  • Elliott Wave Algorithm
  • Screener
  • TradingLevels
  • Trading Game
7 Elliott Wave Analysts

Stay ahead of the market with daily charts and insightful videos
-Your secret to strategic trading!

JOIN HERE


Welcome to TradingLounge (ASIC A.R.No. 321187), specialists in trades, trading education and technical analysis, covering stocks, indices, commodities, forex and cryptocurrencies.

When you join TradingLounge you have access to everything we offer, including trade tools, educational content and a social platform to chat with like-minded investors.

Read more

@Copyright 2024 by tradinglounge.com

Contact Us

Australian no: 02 4787 6020

International no: +61 (2) 47876020

Pay with:

Find us on