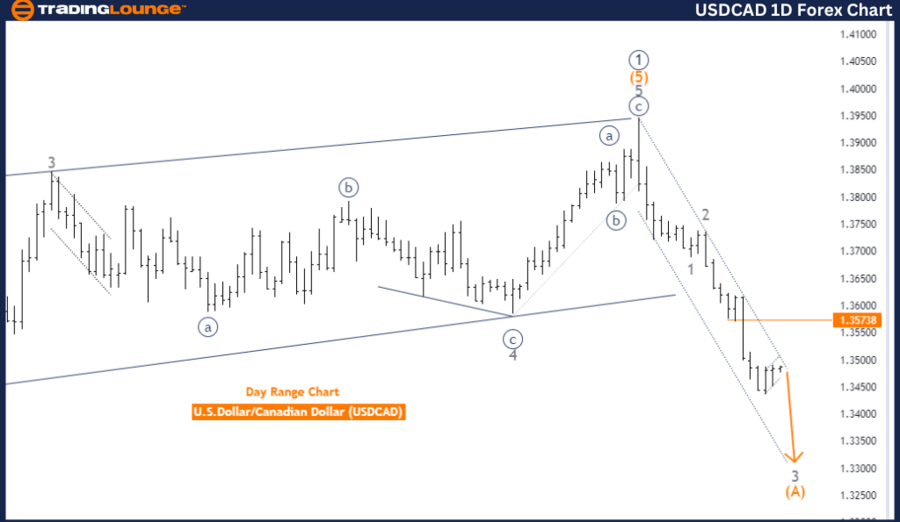
USDCAD Elliott Wave Analysis - Trading Lounge Day Chart
U.S. Dollar / Canadian Dollar Day Chart Analysis
USDCAD Elliott Wave Technical Analysis
Function: Counter Trend
Mode: Impulsive as A
Structure: Gray Wave 3
Position: Orange Wave A
Next Higher Degrees Direction: Gray Wave 4
Details: Gray Wave 2 appears completed, and Gray Wave 3 is now active. Wave Cancel invalidation level: 1.35738.
The USD/CAD currency pair is currently in a counter-trend phase, as highlighted by the Elliott Wave analysis on the daily chart. The market is exhibiting impulsive behaviour within Wave A, indicating a temporary reversal against the dominant trend. The primary structure under consideration is Gray Wave 3, which has begun following the completion of Gray Wave 2.
The analysis indicates that Gray Wave 2 has likely been completed, with the market transitioning into Gray Wave 3. This wave is part of an impulsive movement, generally occurring in the direction of the overall trend after a corrective phase. The current market position is within Orange Wave A, a crucial component of the ongoing impulsive movement.
Looking ahead, the direction for the next higher degrees will be determined by the development of Gray Wave 4, which is expected to follow Gray Wave 3's completion. This suggests that after the completion of Gray Wave 3, the market may enter a corrective phase in Gray Wave 4 before potentially resuming its broader trend.
Summary:
- The USD/CAD pair is in a counter-trend phase on the daily chart.
- Gray Wave 2 has completed, with Gray Wave 3 now underway.
- The current market position is within Orange Wave A, which is part of the impulsive structure.
- The analysis anticipates the continuation of Gray Wave 3, with a potential transition to Gray Wave 4 in the near future.
- The analysis remains valid as long as the price does not breach the wave cancel invalidation level of 1.35738.
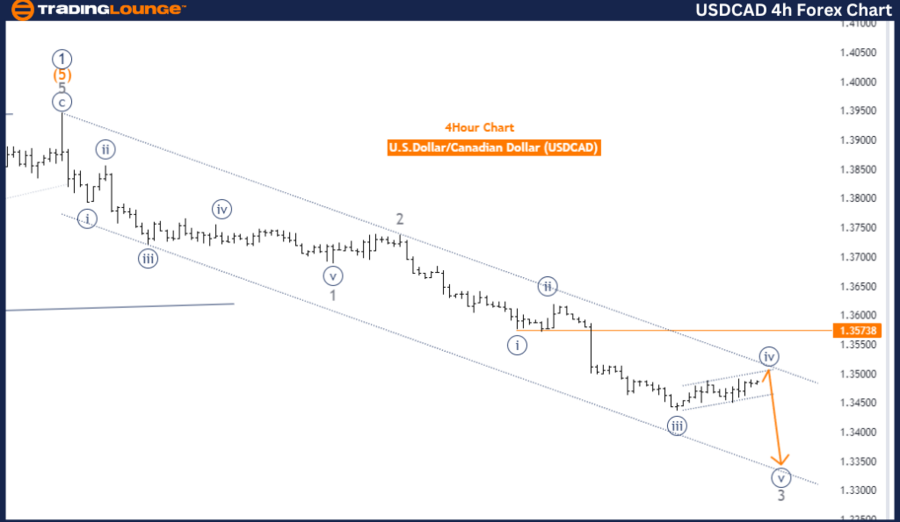
USDCAD Elliott Wave Analysis - Trading Lounge 4-Hour Chart
U.S. Dollar / Canadian Dollar 4-Hour Chart Analysis
USDCAD Elliott Wave Technical Analysis
Function: Counter Trend
Mode: Corrective
Structure: Navy Blue Wave 4
Position: Gray Wave 3
Next Lower Degrees Direction: Navy Blue Wave 5
Details: Navy Blue Wave 3 appears completed, Navy Blue Wave 4 is currently active and nearing its end. Wave Cancel invalidation level: 1.35738.
The USD/CAD currency pair is presently in a counter-trend phase, as shown by the Elliott Wave analysis on the 4-hour chart. The market is in a corrective mode, which typically occurs when the market temporarily moves against the prevailing trend. The primary structure under analysis is Navy Blue Wave 4, part of a broader corrective pattern following the completion of the impulsive Navy Blue Wave 3.
Currently, the market is positioned within Gray Wave 3 as part of the larger Navy Blue Wave 4. This suggests that the market is in the midst of a corrective phase that is approaching its conclusion. The direction for the next lower degrees will be influenced by the development of Navy Blue Wave 5, indicating that once Navy Blue Wave 4 ends, the market may resume its downward movement in Navy Blue Wave 5.
Key points in the analysis underscore that Navy Blue Wave 3 has likely completed. Navy Blue Wave 4 is currently active and is expected to conclude soon. This wave is part of the corrective structure, after which the market may potentially resume its downward trend in Navy Blue Wave 5.
Summary:
- The USDCAD pair is in a corrective phase on the 4-hour chart.
- Navy Blue Wave 3 has been completed, and Navy Blue Wave 4 is currently unfolding.
- The analysis suggests that Navy Blue Wave 4 is approaching its conclusion.
- The market may soon transition into Navy Blue Wave 5, indicating a continuation of the broader downward trend.
This analysis remains valid as long as the price does not exceed the wave cancel invalidation level of 1.35738.
Technical Analyst: Malik Awais
Source: visit Tradinglounge.com and learn From the Experts Join TradingLounge Here
Previous: GBPUSD Elliott Wave Technical Analysis
Special Trial Offer - 0.76 Cents a Day for 3 Months! Click here
Access 7 Analysts Over 200 Markets Covered. Chat Room With Support