13Mar

Gain Valuable Insights into Potential Market Movements JPMorgan Equity Premium Income ETF – JEPI Elliott Wave Technical Analysis

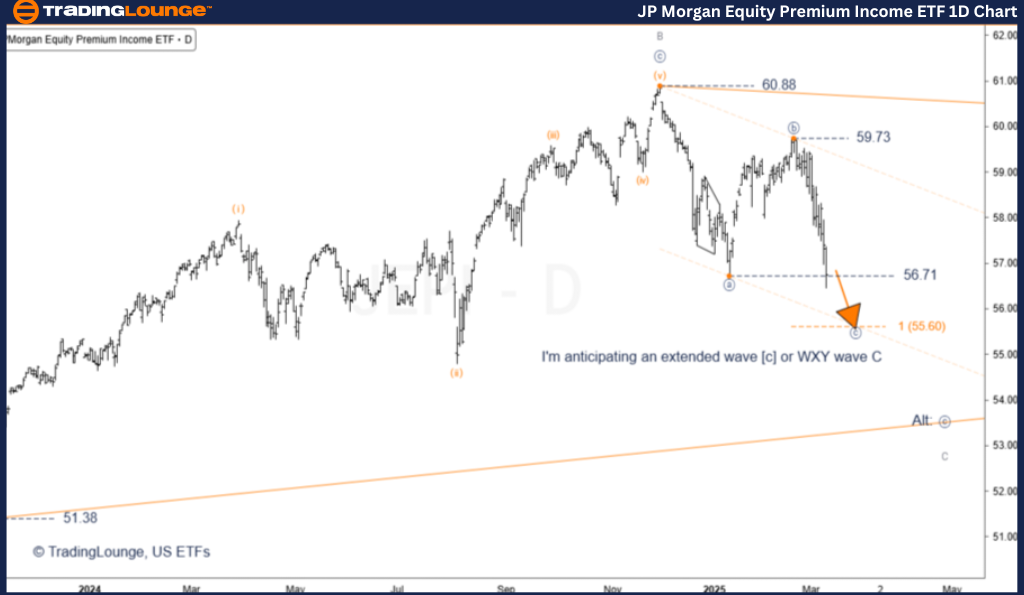
JPMorgan Equity Premium Income ETF – JEPI (1D) Elliott Wave Analysis

JEPI ETF Daily Chart Analysis

JEPI Elliott Wave Technical Analysis

Function: Major Trend (Minor Degree, Grey)

Mode: Corrective

Structure: Triangle

Position: Wave [c] of C

Direction: Decline

JEPI ETF Analysis Overview

  • The bearish trend remains in force, approaching the completion of wave C within the triangle pattern.
  • The $56.71 low of wave [a] has been breached, confirming the zigzag structure.
  • Signs of wave extension in wave [c] indicate that a complex zigzag may not be forming.
  • Once wave [c] completes, a rally is expected in the form of three corrective major waves to form wave [d].
  • If wave C follows a WXY structure, the three corrective waves will be short-lived to form wave [x] of C.
  • The guideline of wave equality is expected to be fulfilled at $55.60.

Invalidation Level: $59.73

JPMorgan-Equity-Prem...


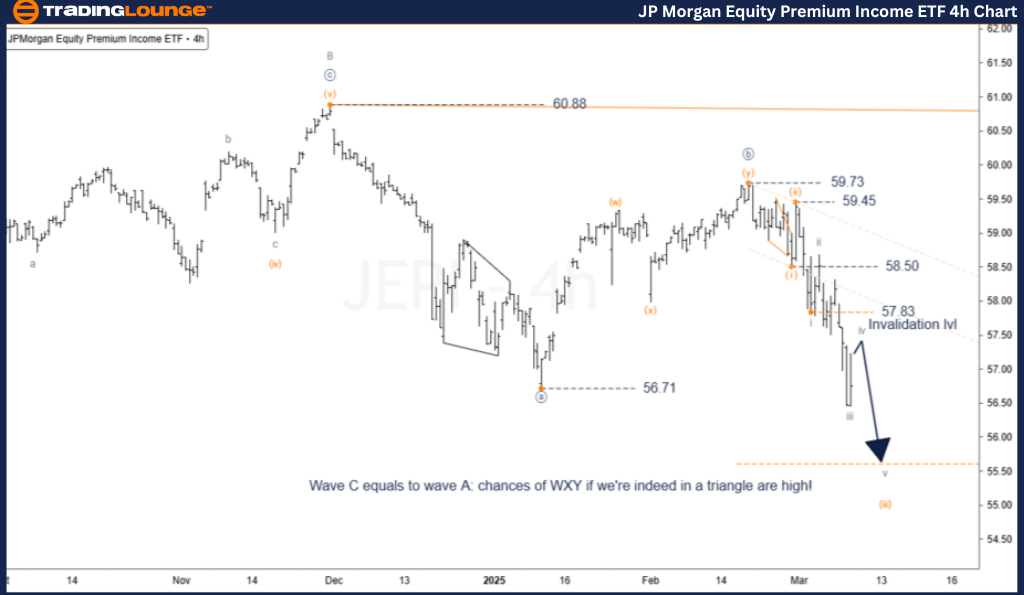
JPMorgan Equity Premium Income ETF – JEPI (4H) Elliott Wave Analysis

JEPI ETF Hourly Chart Technical Analysis

Function: Major Trend (Minor Degree, Grey)

Mode: Impulsive

Structure: Impulse

Position: Wave iv of (iii) within [c] of C (Minor Degree)

Direction: Decline

JEPI ETF Analysis Overview

  • The downtrend is expected to resume once wave iv pullback is complete.
  • Wave iv is likely to terminate around $57.50.
  • The next movement should be impulsive, pushing JEPI towards the $55.60 target.
  • Any movement above the invalidation level suggests that the market is in wave [x] or that wave [c] is forming a more complex structure.

Invalidation Level: $57.83

Technical Analyst: Siinom

Source: Visit Tradinglounge.com and learn from the Experts. Join TradingLounge Here 

See Previous: iShares Bitcoin Trust ETF Elliott Wave Technical Analysis

VALUE Offer - Buy 1 Month & Get 3 Months!Click here

Access 7 Analysts Over 200 Markets Covered. Chat Room With Support

JPMorgan-Equity-Prem...


Conclusion

  • The decline in JEPI remains ongoing, and it is premature to conclude that wave C is near completion.
  • Once wave C completes, a rally forming wave D is expected.
  • Strict adherence to Elliott Wave rules and monitoring invalidation levels is crucial to avoid unnecessary losses.

Related

U.S. Dollar / Canadian Dollar (USDCAD) Elliott Wave Technical Analysis: Forex Trends, Corrective Phases, and Expert Insights

U.S. Dollar / Canadian Dollar (USDCAD) Elliott Wave Technical Analysis: Forex Trends, Corrective Phases, and Expert Insights

USDCAD Elliott Wave analysis dives into impulsive trends, corrective phases, and future forecasts ba...

Read More >
Wheat Elliott Wave Analysis: Stay Ahead with Key Price Forecasts and Trading Strategies

Wheat Elliott Wave Analysis: Stay Ahead with Key Price Forecasts and Trading Strategies

This article provides an in-depth Wheat Elliott Wave analysis, highlighting the current price foreca...

Read More >
Salesforce Inc. (CRM) Elliott Wave Analysis: Salesforce Stock Trends, Bullish Forecasts, and Technical Insights for Smarter Trading

Salesforce Inc. (CRM) Elliott Wave Analysis: Salesforce Stock Trends, Bullish Forecasts, and Technical Insights for Smarter Trading

CRM Elliott Wave Analysis focusing on Salesforce stock trends and technical patterns. This analysis ...

Read More >
Elliott Wave Technical Analysis for AbbVie Stock: Forecast, Price Prediction, and Trading Opportunities

Elliott Wave Technical Analysis for AbbVie Stock: Forecast, Price Prediction, and Trading Opportunities

This detailed AbbVie stock analysis applies Elliott Wave theory to assess the stock's current pr...

Read More >
Understanding MSTR US Stock Market Trajectory and Support Levels: MicroStrategy Inc. (MSTR) Elliott Wave Technical Analysis

Understanding MSTR US Stock Market Trajectory and Support Levels: MicroStrategy Inc. (MSTR) Elliott Wave Technical Analysis

Explore the Elliott Wave Theory as applied to MicroStrategy Inc. (MSTR), providing a comprehensive a...

Read More >
Comprehensive Analysis of the Swiss Market Index (SMI) delves into the Elliott Wave Technical Analysis: day and weekly charts

Comprehensive Analysis of the Swiss Market Index (SMI) delves into the Elliott Wave Technical Analysis: day and weekly charts

This comprehensive analysis of the Swiss Market Index (SMI) delves into the Elliott Wave patterns on...

Read More >

Buy 1 Month

Get 3 Months!

Special Offer:

Trade Recommendations

Unleash the power of deversified trading with our comprehensive portfolio, covering:

  • Stock Trades
  • Crypto Trades
  • Forex Trades
  • Commodity Trades
Elliott Wave Analysis

Gain a competive edge with expert insights in to:

  • Global Indices
  • US Stocks & ASX Stocks
  • Forex & Crypto
  • Commodities
Top-Notch Trading Tools

Equip yourself with the tools of success:

  • Social Chat
  • Elliott Wave Algorithm
  • Screener
  • TradingLevels
  • Trading Game
7 Elliott Wave Analysts

Stay ahead of the market with daily charts and insightful videos
-Your secret to strategic trading!

JOIN HERE


Welcome to TradingLounge (ASIC A.R.No. 321187), specialists in trades, trading education and technical analysis, covering stocks, indices, commodities, forex and cryptocurrencies.

When you join TradingLounge you have access to everything we offer, including trade tools, educational content and a social platform to chat with like-minded investors.

Read more

@Copyright 2024 by tradinglounge.com

Contact Us

Australian no: 02 4787 6020

International no: +61 (2) 47876020

Pay with:

Find us on