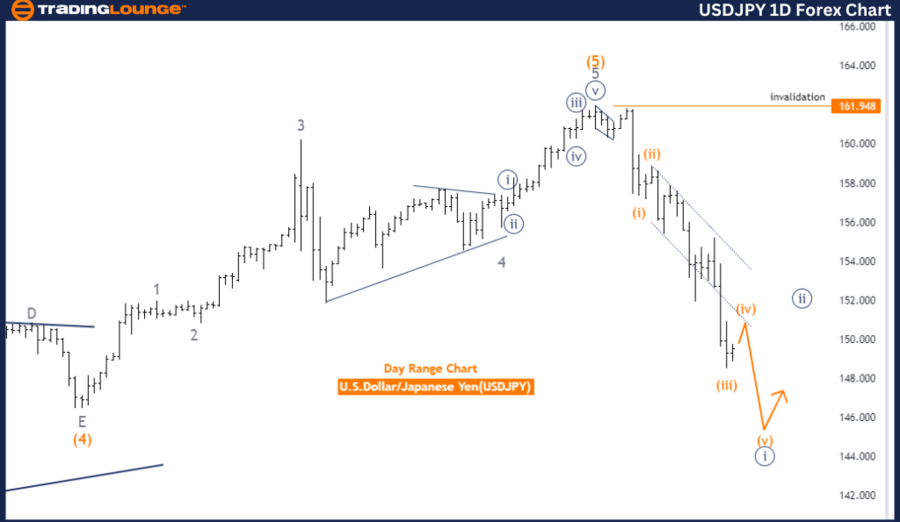
USD/JPY Elliott Wave Analysis Trading Lounge Day Chart
U.S. Dollar / Japanese Yen (USD/JPY) Day Chart Analysis
USD/JPY Elliott Wave Technical Analysis
Function: Trend
Mode: Impulsive
Structure: Navy Blue Wave 1
Position: Gray wave 1
Direction Next Higher Degrees: Navy Blue Wave 2
Details: Navy blue wave 1 of gray wave 1 is active. Wave cancel invalid level: 161.948
The USD/JPY Elliott Wave Analysis on the day chart shows a trend function with an impulsive mode. The current wave structure is navy blue wave 1, part of the larger gray wave 1. This suggests the market is in the early stages of a new upward trend, with navy blue wave 1 representing the initial phase.
The position within the wave structure is at gray wave 1. This indicates the market is in the first wave of a larger trend, suggesting further impulsive waves as the trend progresses. The direction for the next higher degrees is navy blue wave 2. After Navy Blue Wave 1, a corrective phase (Navy Blue Wave 2) will occur before the primary upward trend resumes.
Details show navy blue wave 1 of gray wave 1 is currently active, indicating strong upward momentum. As the first wave of a new trend, navy blue wave 1 typically sets the stage for subsequent waves.
The wave cancel invalid level is set at 161.948. If USD/JPY moves below this threshold, the current wave count would be invalidated, necessitating a reassessment of the wave count and market outlook.
In summary, the USD/JPY Elliott Wave Analysis on the day chart indicates the market is in an impulsive phase within navy blue wave 1, positioned in gray wave 1. This phase is characterized by strong upward momentum, with a corrective phase expected to follow, represented by navy blue wave 2. The wave cancel invalid level of 161.948 is critical for validating the current wave structure; a breach would require reassessment.
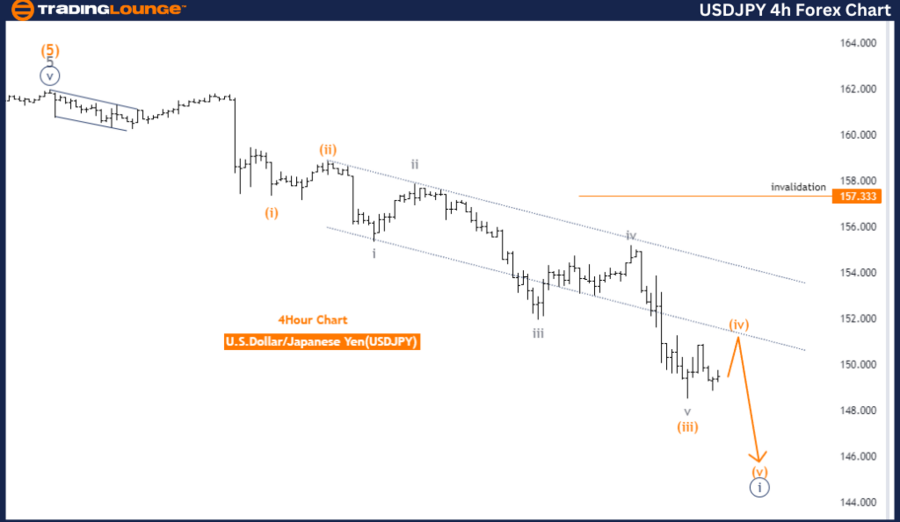
USD/JPY Elliott Wave Analysis Trading Lounge 4-Hour Chart
U.S. Dollar / Japanese Yen (USD/JPY) 4-Hour Chart Analysis
USD/JPY Elliott Wave Technical Analysis
Function: Counter Trend
Mode: Corrective
Structure: Orange wave 4
Position: Navy Blue Wave 1
Direction Next Lower Degrees: Orange wave 5
Details: Orange wave 3 of 1 appears complete, now orange wave 4 is active. Wave cancel invalid level: 157.333
The USD/JPY Elliott Wave Analysis on the 4-hour chart indicates a counter-trend function with a corrective mode. The wave structure is currently in orange wave 4, within navy blue wave 1. This suggests the market is undergoing a temporary corrective phase before resuming its primary trend.
Analysis reveals orange wave 3 of 1 appears complete, marking the end of the prior impulsive phase and the beginning of the corrective phase (orange wave 4). This phase is expected to provide a temporary pullback or consolidation before the market resumes its primary trend direction.
The direction for the next lower degrees is identified as orange wave 5. Once the corrective phase of orange wave 4 is completed, the market is likely to transition into the next impulsive phase (orange wave 5), continuing the primary movement observed in previous waves.
The wave cancel invalid level is set at 157.333. If USD/JPY drops below this threshold, the existing wave count would be invalidated, requiring a reassessment of the wave count and market outlook.
In summary, the USD/JPY Elliott Wave Analysis on the 4-hour chart indicates the market is in a corrective phase within orange wave 4, positioned in navy blue wave 1. The completion of Orange Wave 3 marks the transition to this corrective phase, expected to precede the next impulsive phase (Orange Wave 5). The wave cancel invalid level of 157.333 is critical for validating the current wave structure; a breach would require reassessment.
Technical Analyst: Malik Awais
Source: visit Tradinglounge.com and learn From the Experts Join TradingLounge Here
Previous: EURUSD Elliott Wave Technical Analysis
Special Trial Offer - 0.76 Cents a Day for 3 Months! Click here
Access 7 Analysts Over 170 Markets Covered. Chat Room With Support