05May

Insurance Australia Group IAG Elliott Wave Analysis Reveals Key Resistance Targets Before Major Decline | ASX Stock Forecast

ASX: INSURANCE AUSTRALIA GROUP LIMITED – IAG Elliott Wave Technical Analysis

Greetings,

Today’s Elliott Wave update focuses on the Australian Stock Exchange (ASX) stock, INSURANCE AUSTRALIA GROUP LIMITED (ASX:IAG).

Our latest technical analysis suggests that ASX:IAG is completing a B-grey corrective wave and preparing for another downward move. Currently, there are no confirmed bullish signals, making long trade setups high-risk at this stage.

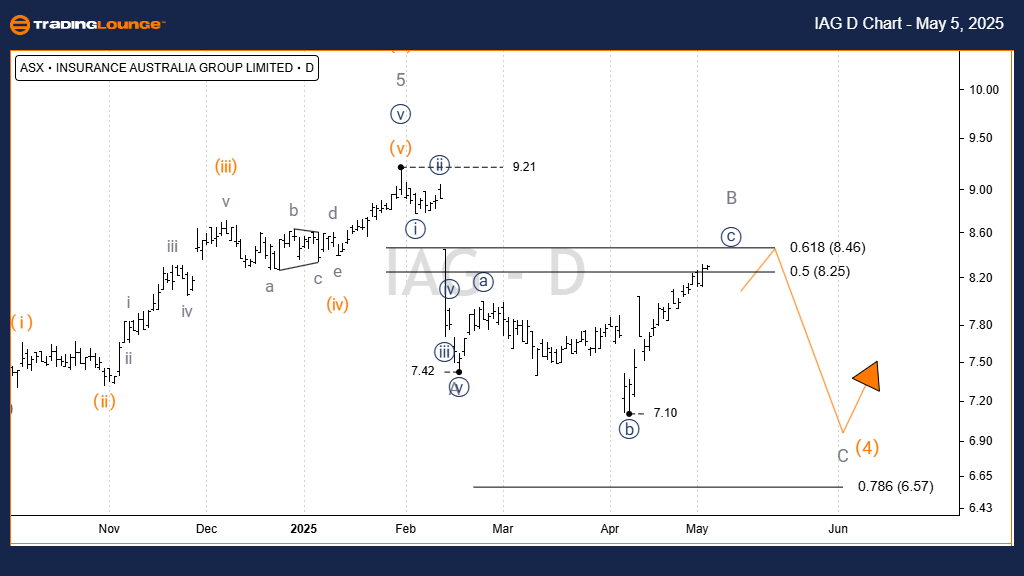
ASX: IAG Elliott Wave Analysis (1D Chart – Semilog Scale)

ASX: INSURANCE AUSTRALIA GROUP LIMITED Day Chart analysis

Function: Major Trend (Minor Degree, Grey)

Mode: Motive

Structure: Impulse

Position: Wave c)) - navy of Wave B - grey

Details: Wave 3) - orange has completed its five-wave impulsive structure.

  • Wave 4) - orange is unfolding lower as a Zigzag correction, labeled A, B, and C - grey.
  • Wave A - grey has finished, and Wave B - grey is advancing higher in an Expanded Flat structure.
  • Wave c)) - navy of Wave B - grey is expected to target the 8.25–8.46 price zone.

Invalidation Point: End of Wave b)) - navy

IAG-ASX-Stock-Day-ch...


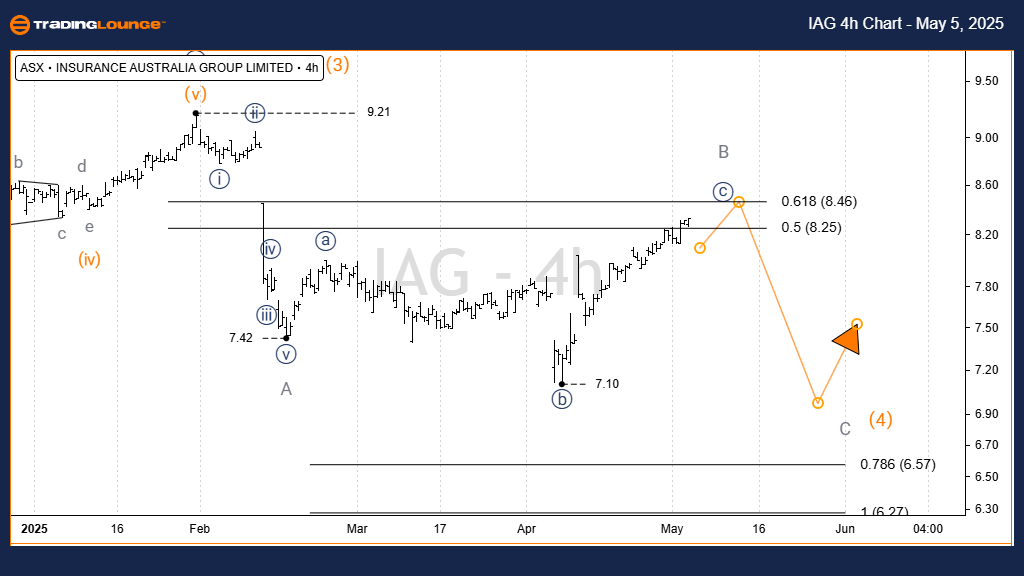
ASX: INSURANCE AUSTRALIA GROUP LIMITED – IAG 4-Hour Chart Analysis

Function: Major Trend (Minor Degree, Grey)

Mode: Motive

Structure: Impulse

Position: Wave c)) - navy of Wave B - grey

Details:

  • From the 7.420 price level, Wave B - grey is forming as an Expanded Flat, reflecting sideways movement with low momentum.
  • Wave b)) - navy shows greater complexity compared to wave a)) - navy, while wave c)) - navy is displaying stronger bullish momentum, characteristic of Flat pattern formations.
  • Price action is anticipated to climb toward the 8.25–8.46 range before the completion of Wave B - grey and the initiation of a Wave C - grey decline.

Invalidation Point: 7.100

Technical Analyst: Hua (Shane) Cuong, CEWA-M (Master’s Designation).

Source: Visit Tradinglounge.com and learn from the Experts. Join TradingLounge Here 

See Previous: NEWMONT CORPORATION - NEM Elliott Wave Technical Analysis

VALUE Offer - Buy 1 Month & Get 3 Months!Click here

Access 7 Analysts Over 200 Markets Covered. Chat Room With Support

IAG-ASX-Stock-4H-cha...


Conclusion
Our Elliott Wave analysis on ASX: INSURANCE AUSTRALIA GROUP LIMITED (ASX:IAG) highlights critical price zones and key invalidation points, providing a structured outlook for traders and investors. Monitoring these levels enhances confidence in assessing the next market moves.
We are committed to offering a professional, objective, and strategic perspective in our technical analysis.

Related

Eaton Corp PLC Stocks Elliott Wave Technical Analysis: ETN Currently in an Impulsive Uptrend, Investors Can Gauge Upcoming Opportunities

Eaton Corp PLC Stocks Elliott Wave Technical Analysis: ETN Currently in an Impulsive Uptrend, Investors Can Gauge Upcoming Opportunities

This article provides a comprehensive Elliott Wave analysis of Eaton Corp PLC (ETN) using both daily...

Read More >
Berkshire Hathaway Inc.(BRK.B:NYSE) Elliott Wave Technical Analysis 22 November 23

Berkshire Hathaway Inc.(BRK.B:NYSE) Elliott Wave Technical Analysis 22 November 23

Stock Berkshire Hathaway Inc.(BRK.B: NYSE) Elliott Wave Technical Analysis 1-hour and 4-hour Chart d...

Read More >
Understand the Bullish Correction Phase: Natural Gas Commodity Elliottwave Technical Analysis

Understand the Bullish Correction Phase: Natural Gas Commodity Elliottwave Technical Analysis

Discover comprehensive insights into the Natural Gas market with our 2024 price forecast. This analy...

Read More >
Bitcoin/U.S. dollar(BTCUSD) Elliott Wave Technical Analysis 1 November 23

Bitcoin/U.S. dollar(BTCUSD) Elliott Wave Technical Analysis 1 November 23

Bitcoin/U.S. dollar(BTCUSD) Elliott Wave Technical Analysis on 1 November 23 with BTCUSD Analysis Da...

Read More >
Palo Alto Networks (PANW) Stock Forecast: Elliott Wave Signals Bullish Reversal With Price Targets & Key Support at $150

Palo Alto Networks (PANW) Stock Forecast: Elliott Wave Signals Bullish Reversal With Price Targets & Key Support at $150

PANW stock shows bullish momentum with Elliott Wave analysis indicating a completed correction and a...

Read More >
Soybeans Elliott Wave Technical Analysis: Highlighting Current Commodity Market Trends and Bearish Trend

Soybeans Elliott Wave Technical Analysis: Highlighting Current Commodity Market Trends and Bearish Trend

This article provides an in-depth Soybeans Elliott Wave analysis, market trends and price forecasts...

Read More >

$1 for 2 Weeks

then $29 a month!

What a Special Offer!

Trade Recommendations

Unleash the power of deversified trading with our comprehensive portfolio, covering 250+ markets:

  • Stock Trades
  • Crypto Trades
  • Forex Trades
  • Commodity Trades
Elliott Wave Analysis

Gain a competitive edge with expert insights and AI-powered Elliott Wave charting into:

  • Global Indices
  • US Stocks & ASX Stocks
  • Forex & Crypto
  • Commodities
Top-Notch Trading Tools

Equip yourself with the tools of success:

  • Real-time Chat rooms
  • Elliott Wave Algorithm
  • Portfolio tools
  • TradingLevels
  • Screener
  • Trading Game
7 Elliott Wave Analysts

Stay ahead of the market with daily charts and insightful videos
Your secret to strategic trading!

JOIN HERE


Welcome to TradingLounge (ASIC A.R.No. 321187), specialists in trades, trading education and technical analysis, covering stocks, indices, commodities, forex and cryptocurrencies.

When you join TradingLounge you have access to everything we offer, including trade tools, educational content and a social platform to chat with like-minded investors.

Read more

@Copyright 2024 by tradinglounge.com

Contact Us

Australian no: 02 4787 6020

International no: +61 (2) 47876020

Pay with:

Find us on