17Mar

Bitcoin/ U.S. Dollar (BTCUSD) Elliott Wave Analysis: Support & Resistance Levels, and Crypto Market Trends for Traders

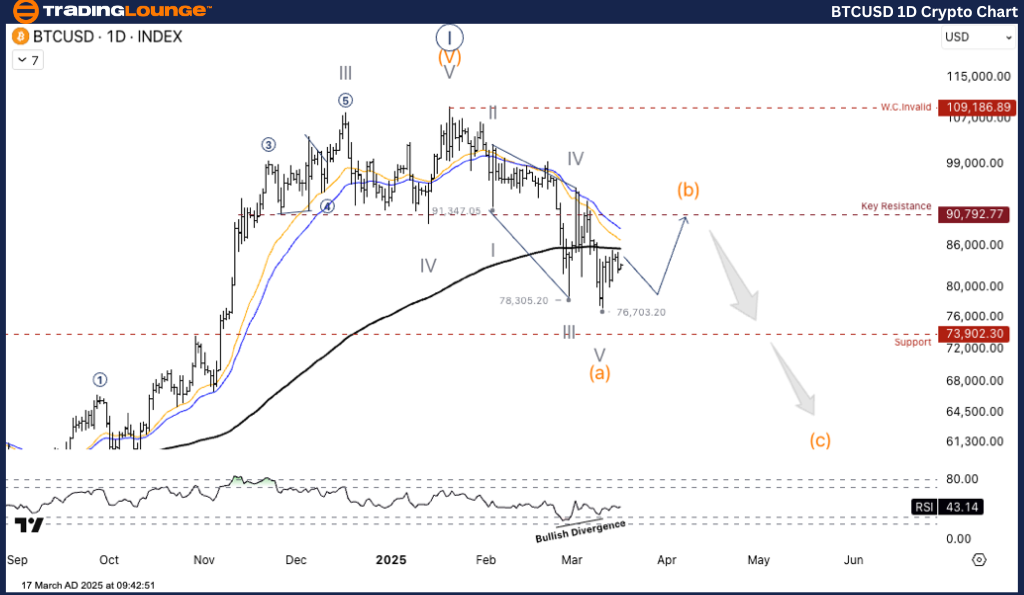
Bitcoin/ U.S. Dollar (BTCUSD) Elliott Wave Analysis – TradingLounge Daily Chart

BTCUSD Elliott Wave Technical Analysis

Function: Counter-Trend

Mode: Corrective

Structure: Zigzag

Position: Wave b

Next Higher Degree Direction: Wave ((II))

Invalidation Level:

Details:

Bitcoin (BTC/USD) is currently forming a corrective Elliott Wave pattern. The price has recently completed Wave A and is now expected to enter Wave B, a short-term upward movement before transitioning into Wave C.

Bitcoin/ U.S. Dollar (BTCUSD) Trading Strategy

BTCUSD remains within a corrective Elliott Wave structure following its drop to the $76,700 support level. It is currently forming a wave b bounce, potentially reaching a critical resistance area before continuing downward into wave c. The current pattern follows a wave (a)-(b)-(c) correction.

  • The price bottomed out at $76,703, confirming the end of wave (a) and the beginning of an upward correction in wave b.
  • A key resistance level is positioned at $90,792, which could serve as a potential reversal area before BTCUSD resumes its downtrend into wave c.

Trading Strategies

✅ For Short-Term Traders (Swing Trade)

  • BTCUSD is likely to rebound towards the $90,000 – $91,000 resistance zone before experiencing another downturn.
  • Short-term traders may consider speculative trades within wave b.

Risk Management:

If BTCUSD approaches the $90,800 resistance level, traders should closely monitor reversal signals, which could indicate the start of a strong decline in wave c.

BTCUSD-1d-crypto-cha...


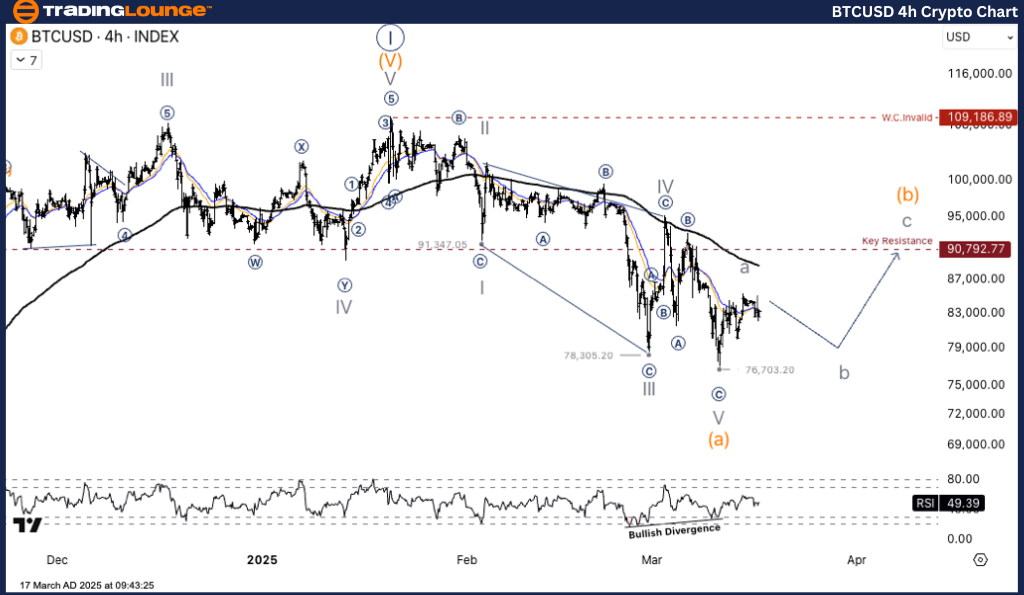
Bitcoin/ U.S. Dollar (BTCUSD) Elliott Wave Analysis – TradingLounge H4 Chart

BTCUSD Elliott Wave Technical Analysis

Function: Counter-Trend

Mode: Corrective

Structure: Zigzag

Position: Wave b

Next Higher Degree Direction: Wave ((II))

Invalidation Level:

Details:

Bitcoin (BTC/USD) is still progressing within a corrective Elliott Wave structure. The price has recently completed Wave A and is now expected to enter Wave B, a temporary upward movement before transitioning into Wave C.

Bitcoin/ U.S. Dollar (BTCUSD) Trading Strategy

BTCUSD remains in a corrective Elliott Wave structure after declining to the $76,700 support level. Currently, wave b is forming, potentially moving towards a key resistance zone before reversing downward into wave c. The pattern follows a wave (a)-(b)-(c) correction.

  • The price reached a low of $76,703, signaling the end of wave (a) and the start of a short-term uptrend in wave b.
  • A major resistance level at $90,792 could act as a key reversal zone before BTCUSD transitions into a bearish wave c.

Trading Strategies

✅ For Short-Term Traders (Swing Trade)

  • BTCUSD may move toward the $90,000 – $91,000 resistance range before experiencing another downward move.
  • Short-term traders could look for potential trading opportunities within wave b.

Risk Management:

If BTCUSD approaches the $90,800 resistance zone, traders should carefully observe reversal patterns, as these could indicate the onset of a strong downward wave c.

Technical Analyst: Kittiampon Somboonsod

Source: Visit Tradinglounge.com and learn from the Experts. Join TradingLounge Here 

Previous: NEOUSD Elliott Wave Technical Analysis

VALUE Offer - Buy 1 Month & Get 3 Months!Click here

Access 7 Analysts Over 200 Markets Covered. Chat Room With Support

BTCUSD-4h-crypto-cha...

Related

Wheat Price Forecast 2025: Wheat Commodity Elliott Wave Signals End of Bearish Cycle with Support Near $500 for Trend Reversal

Wheat Price Forecast 2025: Wheat Commodity Elliott Wave Signals End of Bearish Cycle with Support Near $500 for Trend Reversal

Wheat futures remain bearish, but Elliott Wave analysis signals a potential reversal near $500 as an...

Read More >
Wheat Elliott Wave Technical Analysis: Navigating the Bearish Trend Towards a Potential Reversal

Wheat Elliott Wave Technical Analysis: Navigating the Bearish Trend Towards a Potential Reversal

In our analysis of Wheat's Elliott Wave patterns, we observe a persistent bearish trend since 20...

Read More >
Swiss Market Index Elliott Wave Technical Analysis: Bullish Orange Wave 3 Insights and Market Projections

Swiss Market Index Elliott Wave Technical Analysis: Bullish Orange Wave 3 Insights and Market Projections

The Swiss Market Index (SMI) is in a bullish impulsive phase as analyzed through Elliott Wave Theory...

Read More >
Highlights Significant Price Targets In the Upcoming Waves: Silver (XAGUSD) Commodity Elliott Wave Technical Analysis

Highlights Significant Price Targets In the Upcoming Waves: Silver (XAGUSD) Commodity Elliott Wave Technical Analysis

Our detailed silver market analysis utilizes Elliott Wave theory to forecast potential price movemen...

Read More >
"Comprehensive Commodity Market Elliott Wave Analysis: Bitcoin, ETH/USD, Gold, Silver, and More"

"Comprehensive Commodity Market Elliott Wave Analysis: Bitcoin, ETH/USD, Gold, Silver, and More"

Commodity Market Elliott Wave Analysis Summary - Bitcoin (BTC) and ETH/USD: Tracking Wave v) of 1 o...

Read More >
Bullish Trend Persists: Cocoa Commodity Elliott Wave Technical Analysis

Bullish Trend Persists: Cocoa Commodity Elliott Wave Technical Analysis

In the cocoa commodity market, Elliott Wave Technical Analysis indicates a persistent bullish trend....

Read More >

$1 for 2 Weeks

then $29 a month!

What a Special Offer!

Trade Recommendations

Unleash the power of deversified trading with our comprehensive portfolio, covering 250+ markets:

  • Stock Trades
  • Crypto Trades
  • Forex Trades
  • Commodity Trades
Elliott Wave Analysis

Gain a competitive edge with expert insights and AI-powered Elliott Wave charting into:

  • Global Indices
  • US Stocks & ASX Stocks
  • Forex & Crypto
  • Commodities
Top-Notch Trading Tools

Equip yourself with the tools of success:

  • Real-time Chat rooms
  • Elliott Wave Algorithm
  • Portfolio tools
  • TradingLevels
  • Screener
  • Trading Game
7 Elliott Wave Analysts

Stay ahead of the market with daily charts and insightful videos
Your secret to strategic trading!

JOIN HERE


Welcome to TradingLounge (ASIC A.R.No. 321187), specialists in trades, trading education and technical analysis, covering stocks, indices, commodities, forex and cryptocurrencies.

When you join TradingLounge you have access to everything we offer, including trade tools, educational content and a social platform to chat with like-minded investors.

Read more

@Copyright 2024 by tradinglounge.com

Contact Us

Australian no: 02 4787 6020

International no: +61 (2) 47876020

Pay with:

Find us on