11Sep

Maruti Suzuki India Stock Prediction: In-Depth Elliott Wave Technical Analysis and Market Trends

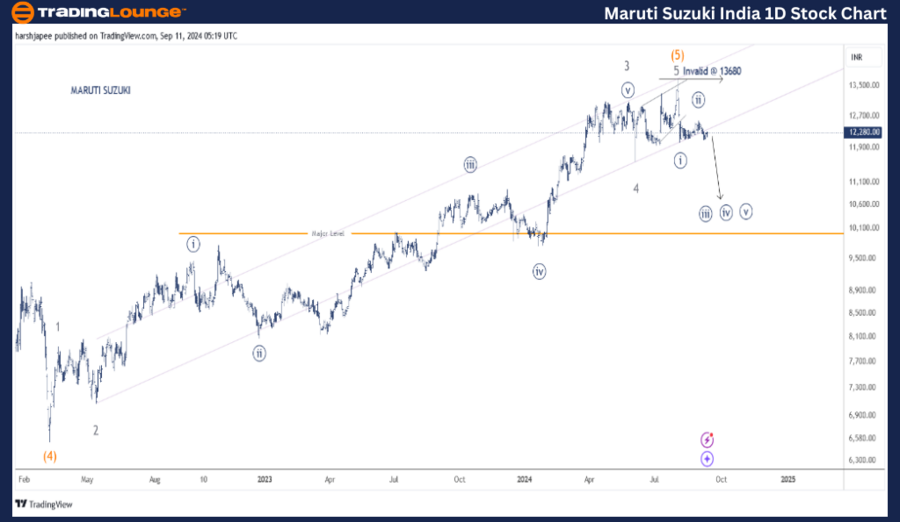
MARUTI SUZUKI INDIA – MARUTI (1D Chart) Elliott Wave Technical Analysis

Maruti Suzuki Elliott Wave Technical Analysis

Function: Counter Trend Lower (Intermediate degree, orange)

Mode: Corrective

Structure: Impulse, within a larger degree Wave A

Position: Minute Wave ((ii)) Navy complete

Details: Minute Wave ((ii)) appears complete just below the 12700-800 zone. Additionally, Minute Wave ((iii)) Navy seems to be progressing.

Invalidation point: 13680-85

Maruti Suzuki Daily Chart Technical Analysis and Potential Elliott Wave Counts:

The daily chart for Maruti Suzuki indicates that a significant top was established around the 13680-85 zone, registered on August 01, 2024. Since then, the stock has declined, breaking through the 12040 level, identified as Minute Wave ((i)), followed by a shallow retracement toward the 12600-700 range, potentially completing Minute Wave ((ii)).

Previously, the stock completed an impulse wave from the 6500 to the 13680 levels, labeled as Intermediate Wave (5) Orange. Minor Waves 1 through 5 Grey also completed, with Wave 5 ending as a diagonal.

With Minute Waves ((i)) and ((ii)) likely set around 12040 and 12600-700, the bearish trend could resume, pushing Minute Wave ((iii)) lower towards the 9500 mark in the medium term.

MARUTI-SUZUKI-INDIA-...


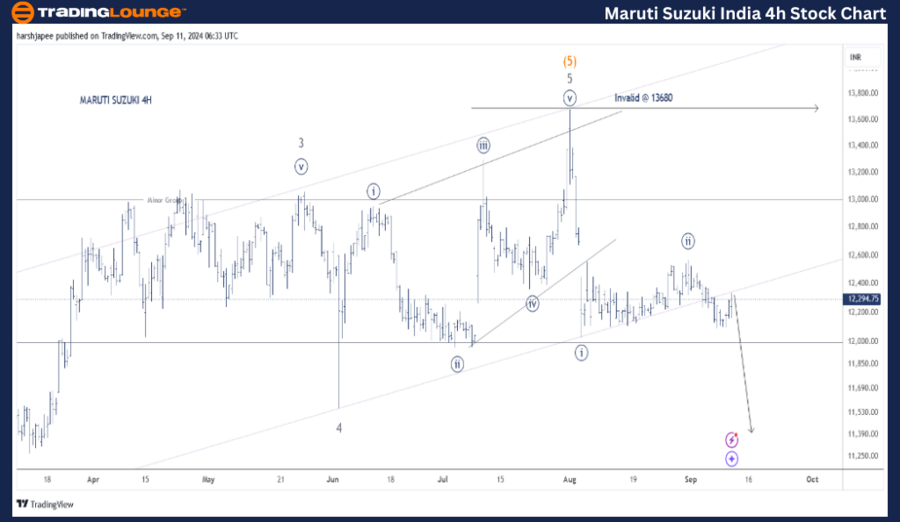
MARUTI SUZUKI INDIA – MARUTI (4H Chart) Elliott Wave Technical Analysis

Maruti Suzuki Elliott Wave Technical Analysis

Function: Counter Trend Lower (Intermediate degree, orange)

Mode: Corrective

Structure: Impulse, within a larger degree Wave A

Position: Minute Wave ((ii)) Navy complete

Details: Minute Wave ((ii)) appears complete just below the 12700-800 zone. Additionally, Minute Wave ((iii)) Navy seems to be progressing. Alternatively, prices may move sideways briefly before Minute Wave ((ii)) terminates.

Invalidation point: 13680-85

Maruti Suzuki 4H Chart Technical Analysis and Potential Elliott Wave Counts:

The 4-hour chart for Maruti Suzuki emphasizes the lower degree waves within Minor Wave 5 Grey. Minute Waves ((i)) through ((v)) Navy complete the ending diagonal of Minor Wave 5 near the 13680 level, followed by a sharp decline.

Currently, Minute Wave ((i)) is identified around 12040, while Minute Wave ((ii)) is near the 12600-700 zone. If this count holds, Minute Wave ((iii)) is underway against the 13680 high.

Conclusion:

Maruti Suzuki is likely progressing within Minute Wave ((iii)) Navy, part of Minor Wave 1 Grey, against the 13680 level

Technical Analyst: Harsh Japee

Source: visit Tradinglounge.com and learn From the Experts Join TradingLounge Here 

Previous: Eicher Motors Elliott Wave Technical Analysis 

Special Trial Offer - 0.76 Cents a Day for 3 Months! Click here

Access 7 Analysts Over 200 Markets Covered. Chat Room With Support

MARUTI-SUZUKI-INDIA-...

Related

Australian Dollar/U.S.Dollar (AUDUSD) Elliott Wave Technical Analysis 15 December 23

Australian Dollar/U.S.Dollar (AUDUSD) Elliott Wave Technical Analysis 15 December 23

AUDUSD Elliott Wave Analysis Trading Lounge Day Chart dated 15 December 23, provides a detailed anal...

Read More >
Australian Dollar/U.S.Dollar Forex Currency Pair: AUDUSD Elliott Wave Technical Analysis Provides in-depth insights

Australian Dollar/U.S.Dollar Forex Currency Pair: AUDUSD Elliott Wave Technical Analysis Provides in-depth insights

Our comprehensive AUDUSD Elliott Wave Analysis provides in-depth insights into the current market tr...

Read More >
In-depth analysis of Theta Token (THETAUSD) Cryp Price News Today - Elliott Wave Technical Analysis

In-depth analysis of Theta Token (THETAUSD) Cryp Price News Today - Elliott Wave Technical Analysis

This article provides an in-depth analysis of Theta Token (THETAUSD) using the Elliott Wave Theory t...

Read More >
NEE Stocks Elliott Wave Technical Analysis: NextEra Energy Inc. (NEE) Stock Analysis & Strategic Forecast

NEE Stocks Elliott Wave Technical Analysis: NextEra Energy Inc. (NEE) Stock Analysis & Strategic Forecast

This article offers an in-depth Elliott Wave analysis of NextEra Energy Inc. (NEE), breaking down bo...

Read More >
Trade XJO Effectively with Expert Strategies and Stay Updated on Index market with S&P/ASX 200 Index Elliott Wave Technical Analysis

Trade XJO Effectively with Expert Strategies and Stay Updated on Index market with S&P/ASX 200 Index Elliott Wave Technical Analysis

Stay ahead in the S&P/ASX 200 market with our comprehensive trading guide. This analysis covers Elli...

Read More >

Buy 1 Month

Get 3 Months!

Special Offer:

Trade Recommendations

Unleash the power of deversified trading with our comprehensive portfolio, covering:

  • Stock Trades
  • Crypto Trades
  • Forex Trades
  • Commodity Trades
Elliott Wave Analysis

Gain a competive edge with expert insights in to:

  • Global Indices
  • US Stocks & ASX Stocks
  • Forex & Crypto
  • Commodities
Top-Notch Trading Tools

Equip yourself with the tools of success:

  • Social Chat
  • Elliott Wave Algorithm
  • Screener
  • TradingLevels
  • Trading Game
7 Elliott Wave Analysts

Stay ahead of the market with daily charts and insightful videos
-Your secret to strategic trading!

JOIN HERE


Welcome to TradingLounge (ASIC A.R.No. 321187), specialists in trades, trading education and technical analysis, covering stocks, indices, commodities, forex and cryptocurrencies.

When you join TradingLounge you have access to everything we offer, including trade tools, educational content and a social platform to chat with like-minded investors.

Read more

@Copyright 2024 by tradinglounge.com

Contact Us

Australian no: 02 4787 6020

International no: +61 (2) 47876020

Pay with:

Find us on