05Nov

Netflix (NFLX) Elliott Wave Technical Analysis: In-Depth Stock Forecast and Trading Insights

Elliott Wave Analysis of NFLX

In this comprehensive Elliott Wave analysis, we assess Netflix Inc. (NFLX) using both daily and 1-hour timeframes to evaluate current wave formations and forecast likely price trajectories.

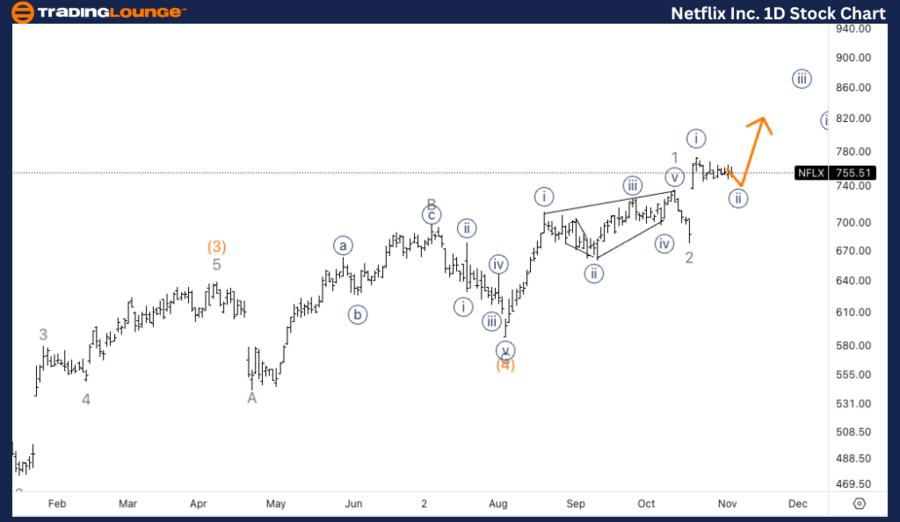
Inc. NFLX Elliott Wave Analysis – Daily Chart

NFLX Elliott Wave Technical Analysis

Function: Trend

Mode: Impulsive

Structure: Motive

Position: Wave 3 of (5)

Direction: Upward Trend in Wave 3

Details: Netflix’s price movement indicates potential further upside after a leading diagonal in wave 1 and a sharp retracement in wave 2, setting the stage for a stronger rally in wave 3.

NFLX Elliott Wave Technical Analysis – Daily Chart

On the daily chart, Netflix is positioned in wave 3 of (5) within a broader impulsive pattern. Having completed a leading diagonal in wave 1, followed by a sharp correction in wave 2, we now look for further upward momentum in wave 3, which is characteristically the most extended and dynamic wave within an impulsive sequence.

Netflix-Inc-1d-stock...


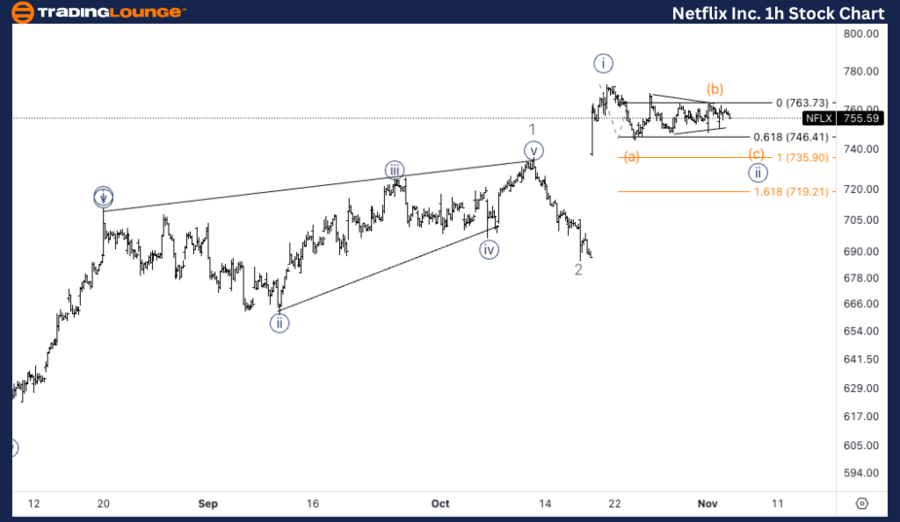
Netflix Inc. (NFLX) NFLX Elliott Wave Technical Analysis – 1-Hour Chart

Function: Trend

Mode: Impulsive

Structure: Motive

Position: Wave (b) of {ii}

Direction: Downward Correction in Wave (c)

Details: Anticipating a downward move in wave (c) of {ii}, with a potential bottom around $735, which aligns with wave (c) reaching parity with wave (a) as the triangle pattern in wave (b) nears completion.

NFLX Elliott Wave Technical Analysis – 1-Hour Chart

The 1-hour chart indicates that NFLX is nearing the end of a triangle pattern in wave (b) within wave {ii}. A decline in wave (c) of {ii} is projected, with potential support near $735, where waves (c) and (a) could achieve parity. Following the completion of wave {ii}, bullish sentiment may dominate again, with momentum building in wave {iii}.

Technical Analyst: Alessio Barretta

Source: visit Tradinglounge.com and learn From the Experts Join TradingLounge Here 

See Previous:Mastercard Inc. (MA) Elliott Wave Technical Analysis  

VALUE Offer - Buy 1 Month & Get 3 Months!Click here

Access 7 Analysts Over 200 Markets Covered. Chat Room With Support

Netflix-Inc-1h-stock...

Related

AMCOR Stock Forecast: ASX AMC Starts Bullish Wave 3 After Corrective Zigzag – Elliott Wave Analysis, Price Targets, Trade Setups

AMCOR Stock Forecast: ASX AMC Starts Bullish Wave 3 After Corrective Zigzag – Elliott Wave Analysis, Price Targets, Trade Setups

AMCOR (ASX: AMC) completes a corrective wave and begins bullish Wave (3). Discover price targets, in...

Read More >
Alphabet Inc.(GOOGL) Stocks Elliott Wave Technical Analysis To Identify Key Entry and Exit Points While Monitoring Market Trends

Alphabet Inc.(GOOGL) Stocks Elliott Wave Technical Analysis To Identify Key Entry and Exit Points While Monitoring Market Trends

This GOOGL Elliott Wave Analysis explores Alphabet Inc.'s stock trends using the Elliott Wave Th...

Read More >
Currency Pair New Zealand Dollar/U.S.Dollar (NZDUSD) Forex Elliott Wave Technical Analysis

Currency Pair New Zealand Dollar/U.S.Dollar (NZDUSD) Forex Elliott Wave Technical Analysis

Discover the secrets to successful NZDUSD trading with our detailed Elliott Wave analysis. Dive into...

Read More >
KOSPI Composite Index Elliott Wave Technical Analysis shows Bullish Trend Currently on both Daily and Weekly Charts

KOSPI Composite Index Elliott Wave Technical Analysis shows Bullish Trend Currently on both Daily and Weekly Charts

The KOSPI Composite is currently in a bullish trend, supported by Elliott Wave analysis on both dail...

Read More >
Maruti Suzuki India Stock Prediction: In-Depth Elliott Wave Technical  Analysis and Market Trends

Maruti Suzuki India Stock Prediction: In-Depth Elliott Wave Technical Analysis and Market Trends

This article provides a detailed Elliott Wave analysis of Maruti Suzuki stock. It covers key technic...

Read More >
CAC 40 Elliott Wave Forecast with Daily and Weekly Chart Analysis Highlighting Corrective Wave Structure and France Stock Market

CAC 40 Elliott Wave Forecast with Daily and Weekly Chart Analysis Highlighting Corrective Wave Structure and France Stock Market

Accurate Elliott Wave forecast for the CAC 40 index with detailed daily and weekly chart analysis. U...

Read More >

Buy 1 Month

Get 3 Months!

Special Offer:

Trade Recommendations

Unleash the power of deversified trading with our comprehensive portfolio, covering:

  • Stock Trades
  • Crypto Trades
  • Forex Trades
  • Commodity Trades
Elliott Wave Analysis

Gain a competive edge with expert insights in to:

  • Global Indices
  • US Stocks & ASX Stocks
  • Forex & Crypto
  • Commodities
Top-Notch Trading Tools

Equip yourself with the tools of success:

  • Social Chat
  • Elliott Wave Algorithm
  • Screener
  • TradingLevels
  • Trading Game
7 Elliott Wave Analysts

Stay ahead of the market with daily charts and insightful videos
-Your secret to strategic trading!

JOIN HERE


Welcome to TradingLounge (ASIC A.R.No. 321187), specialists in trades, trading education and technical analysis, covering stocks, indices, commodities, forex and cryptocurrencies.

When you join TradingLounge you have access to everything we offer, including trade tools, educational content and a social platform to chat with like-minded investors.

Read more

@Copyright 2024 by tradinglounge.com

Contact Us

Australian no: 02 4787 6020

International no: +61 (2) 47876020

Pay with:

Find us on