06Dec

USDCHF Elliott Wave Technical Analysis Highlighting Navy Blue Wave 2, Orange Wave C, Critical Levels, and Market Dynamics for Traders

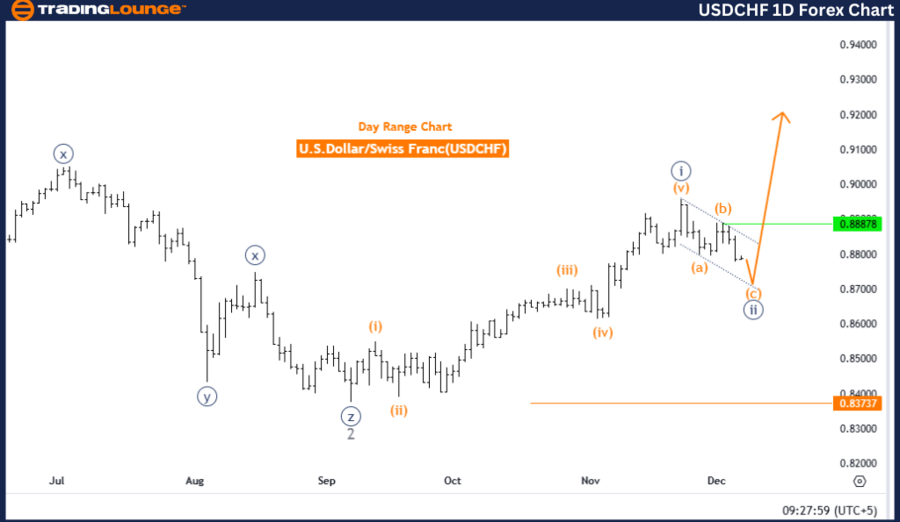
U.S. Dollar/Swiss Franc (USDCHF) Elliott Wave Analysis - Trading Lounge Day Chart

USDCHF Elliott Wave Technical Analysis

Function: Counter Trend

Mode: Corrective

Structure: Navy Blue Wave 2

Position: Gray Wave 3

Direction Next Higher Degrees: Navy Blue Wave 3

Details: Navy Blue Wave 1 appears complete; Navy Blue Wave 2 is currently active.

Wave Cancel Invalid Level: 0.83737

Analysis Overview
The USDCHF daily chart presents a detailed Elliott Wave analysis, highlighting a counter-trend correction currently in progress. The chart indicates the development of Navy Blue Wave 2, representing a corrective phase within the broader upward trend. The position of Gray Wave 3 signals the continuation of this corrective activity.

The analysis suggests Navy Blue Wave 1 has concluded, allowing the transition to Navy Blue Wave 2. In Elliott Wave Theory, corrective waves typically signify temporary reversals within a primary trend. Following the completion of Navy Blue Wave 2, the market is expected to resume its upward trajectory with the development of Navy Blue Wave 3.

Critical Levels and Observations

  • Invalidation Level: 0.83737 – A drop below this point would require reevaluating the current wave structure and could indicate a shift away from the expected corrective pattern.

This analysis provides essential insights for traders tracking the current correction phase. By identifying key levels and directional signals, it assists in navigating this transitional period as the market readies for its next impulsive phase.

USDCHF-1d-forex-char...


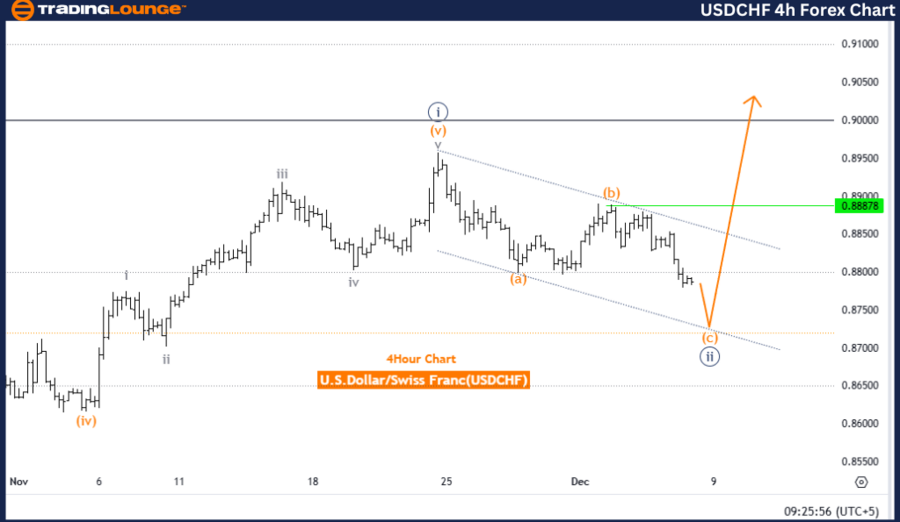
U.S. Dollar/Swiss Franc (USDCHF) Elliott Wave Analysis - Trading Lounge 4-Hour Chart

USDCHF Elliott Wave Technical Analysis

Function: Counter Trend

Mode: Impulsive

Structure: Orange Wave C

Position: Navy Blue Wave 2

Direction Next Higher Degrees: Navy Blue Wave 3

Details: Orange Wave B appears complete; Orange Wave C of 2 is in progress.

Wave Cancel Invalid Level: 0.83737

Analysis Overview
The USDCHF 4-hour chart elaborates on the ongoing Elliott Wave dynamics, emphasizing a counter-trend correction led by Orange Wave C. This wave signifies an impulsive phase within the broader Navy Blue Wave 2 correction, highlighting the market’s preparation for the next phase in the prevailing trend.

The analysis points to the conclusion of Orange Wave B, paving the way for the development of Orange Wave C within Navy Blue Wave 2. This final leg aligns with the expectations of Elliott Wave Theory, signifying the culmination of the corrective structure before the broader trend resumes with Navy Blue Wave 3.

Critical Levels and Observations

  • Invalidation Level: 0.83737 – A move below this price would necessitate a review of the wave structure and potentially indicate a deviation from the expected path.

This analysis outlines the ongoing corrective dynamics, highlighting significant levels and providing traders with a clear understanding of the current transitional stage as the market prepares for its next impulsive move.

Technical Analyst: Malik Awais

Source: visit Tradinglounge.com and learn From the Experts Join TradingLounge Here 

Previous: USDJPY Elliott Wave Technical Analysis 

VALUE Offer - Buy 1 Month & Get 3 Months!Click here

Access 7 Analysts Over 200 Markets Covered. Chat Room With Support

USDCHF-4h-forex-char...

Related

ASX:IAG Elliott Wave Analysis, Stock Forecast, Price Trends, Wave Patterns, Market Insights, and Trading Strategies for Investors

ASX:IAG Elliott Wave Analysis, Stock Forecast, Price Trends, Wave Patterns, Market Insights, and Trading Strategies for Investors

Get the latest ASX:IAG Elliott Wave analysis and stock forecast. Learn how wave patterns influence I...

Read More >
Delves into the Cocoa Commodity Market Analysis through Elliott Wave Theory, Focusing on the Current Corrective Phase

Delves into the Cocoa Commodity Market Analysis through Elliott Wave Theory, Focusing on the Current Corrective Phase

This article delves into the cocoa market analysis through Elliott Wave Theory, focusing on the curr...

Read More >
Our Technical Insights Include Detailed Chart Analysis: CSL LIMITED – CSL Stock Analysis & Elliott Wave Technical Forecast

Our Technical Insights Include Detailed Chart Analysis: CSL LIMITED – CSL Stock Analysis & Elliott Wave Technical Forecast

Explore our comprehensive Elliott Wave analysis of CSL LIMITED (ASX: CSL), focusing on the latest st...

Read More >
Unlocking ASX Trading Success: REECE LIMITED - REH Stock Analysis & Elliott Wave Technical Forecast

Unlocking ASX Trading Success: REECE LIMITED - REH Stock Analysis & Elliott Wave Technical Forecast

This article provides an in-depth Elliott Wave technical analysis of Reece Limited (ASX: REH), offer...

Read More >
LINKUSD Elliott Wave Analysis Showing Chainlink Wave 2 Correction and Setup for Potential Wave 3 Breakout Above Resistance

LINKUSD Elliott Wave Analysis Showing Chainlink Wave 2 Correction and Setup for Potential Wave 3 Breakout Above Resistance

This LINKUSD Elliott Wave analysis offers a technical breakdown of Chainlink’s corrective Wave 2 an...

Read More >
VanEck Semiconductor ETF (SMH) Elliott Wave Analysis: Identifying Bullish Trends and Forecasting Future Price Movements

VanEck Semiconductor ETF (SMH) Elliott Wave Analysis: Identifying Bullish Trends and Forecasting Future Price Movements

This article provides an in-depth Elliott Wave analysis of the VanEck Semiconductor ETF (SMH), exami...

Read More >

$1 for 2 Weeks

then $29 a month!

What a Special Offer!

Trade Recommendations

Unleash the power of deversified trading with our comprehensive portfolio, covering 250+ markets:

  • Stock Trades
  • Crypto Trades
  • Forex Trades
  • Commodity Trades
Elliott Wave Analysis

Gain a competitive edge with expert insights and AI-powered Elliott Wave charting into:

  • Global Indices
  • US Stocks & ASX Stocks
  • Forex & Crypto
  • Commodities
Top-Notch Trading Tools

Equip yourself with the tools of success:

  • Real-time Chat rooms
  • Elliott Wave Algorithm
  • Portfolio tools
  • TradingLevels
  • Screener
  • Trading Game
7 Elliott Wave Analysts

Stay ahead of the market with daily charts and insightful videos
Your secret to strategic trading!

JOIN HERE


Welcome to TradingLounge (ASIC A.R.No. 321187), specialists in trades, trading education and technical analysis, covering stocks, indices, commodities, forex and cryptocurrencies.

When you join TradingLounge you have access to everything we offer, including trade tools, educational content and a social platform to chat with like-minded investors.

Read more

@Copyright 2024 by tradinglounge.com

Contact Us

Australian no: 02 4787 6020

International no: +61 (2) 47876020

Pay with:

Find us on