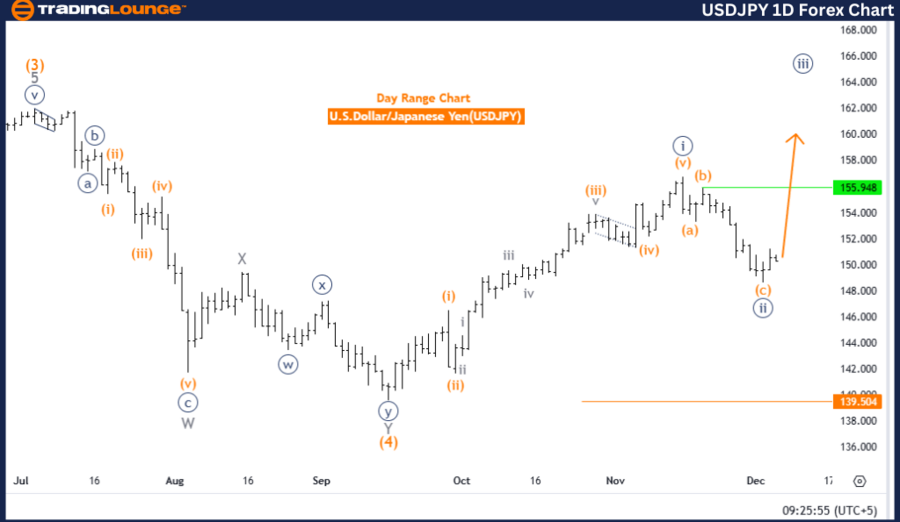
U.S. Dollar/Japanese Yen (USDJPY) Elliott Wave Analysis - Trading Lounge Day Chart Analysis
Function: Bullish Trend
Mode: Impulsive
Structure: Navy Blue Wave 3
Position: Gray Wave 1
Direction (Next Higher Degrees): Navy Blue Wave 3 (Initiated)
Details: Navy Blue Wave 2 appears completed, and Navy Blue Wave 3 is currently in progress.
Wave Cancel Invalidation Level: 139.504
Analysis Overview
The daily chart analysis of USDJPY employs Elliott Wave Theory to underscore a bullish market trend. The current structure suggests that Navy Blue Wave 3 is advancing within an impulsive sequence. Positioned within this larger wave, Gray Wave 1 signals the initial phase of this bullish movement.
Wave Analysis and Progression
-
Completion of Navy Blue Wave 2:
- The analysis indicates the likely completion of Navy Blue Wave 2, setting the stage for Navy Blue Wave 3's upward progression.
-
Development of Navy Blue Wave 3:
- Consistent with Elliott Wave Theory, this wave's progression showcases strong upward momentum, affirming the overall bullish trend.
Invalidation Level
The invalidation level is identified at 139.504. A drop below this level would necessitate a reassessment of the current wave count, potentially signaling a shift away from the anticipated bullish trajectory.
Trading Insights
This technical analysis offers traders a framework to monitor and interpret the bullish trend. By focusing on Elliott Wave patterns and invalidation levels, traders can align strategies with the continuation of the upward momentum. The completion of Navy Blue Wave 2 and the initiation of Navy Blue Wave 3 provide insights into probable market behavior, enhancing trading decisions consistent with Elliott Wave principles.
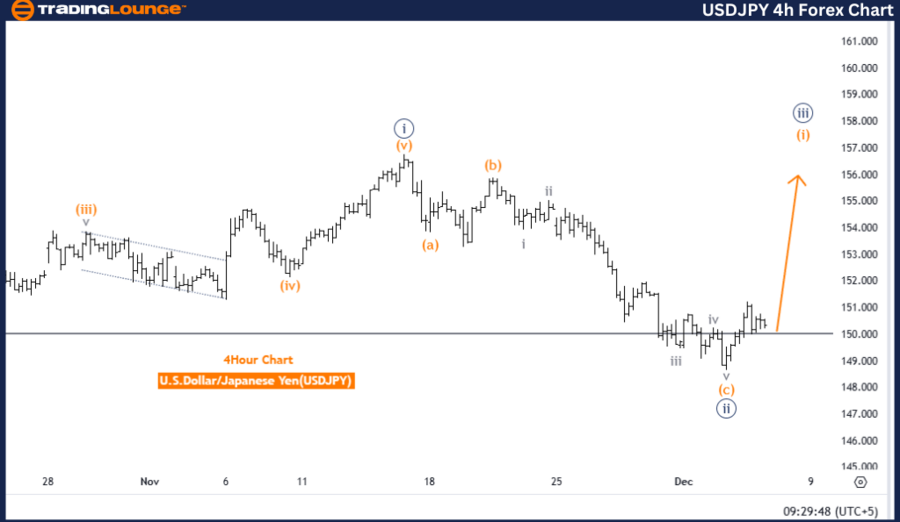
U.S. Dollar/Japanese Yen (USDJPY) Elliott Wave Analysis - Trading Lounge 4-Hour Chart Analysis
USDJPY Elliott Wave Technical Analysis
Function: Bullish Trend
Mode: Impulsive
Structure: Orange Wave 1
Position: Navy Blue Wave 3
Direction (Next Lower Degrees): Orange Wave 2
Details: Navy Blue Wave 2 appears completed, and Orange Wave 1 of Navy Blue Wave 3 is currently in progress.
Wave Cancel Invalidation Level: 139.504
Analysis Overview
The 4-hour chart further highlights USDJPY's bullish trend within Elliott Wave Theory. The current wave structure shows Orange Wave 1 as part of the larger Navy Blue Wave 3, marking the initial phase of this impulsive sequence.
Wave Analysis and Progression
-
Initiation of Orange Wave 1:
- The analysis confirms the start of Orange Wave 1, which adheres to Elliott Wave Theory's principles of recognizing repetitive patterns to forecast market behavior.
-
Bullish Momentum:
- The progression of Orange Wave 1 reflects strong upward momentum, reinforcing the overall bullish outlook.
Invalidation Level
A critical invalidation level is set at 139.504. Any movement below this point would require the current wave count to be re-evaluated, signaling a potential departure from the anticipated bullish trend.
Trading Insights
This analysis equips traders with a structured approach to interpret USDJPY's bullish trend. By observing wave progression and key levels, it supports trading strategies aligned with the upward momentum of the impulsive wave sequence. The identified invalidation level acts as a crucial reference point for tracking possible market deviations.
The detailed structure of Navy Blue Wave 3 and Orange Wave 1 provides valuable insights, enabling traders to make informed decisions in accordance with Elliott Wave principles.
Technical Analyst: Malik Awais
Source: visit Tradinglounge.com and learn From the Experts Join TradingLounge Here
Previous: AUDUSD Elliott Wave Technical Analysis
VALUE Offer - Buy 1 Month & Get 3 Months!Click here
Access 7 Analysts Over 200 Markets Covered. Chat Room With Support