Australian Dollar/U.S. Dollar (AUDUSD) Elliott Wave Analysis - Trading Lounge Day Chart
AUDUSD Elliott Wave Technical Analysis
Function: Bearish Trend
Mode: Impulsive
Structure: Orange Wave 3
Position: Navy Blue Wave 3
Direction Next Lower Degrees: Orange Wave 3 (Started)
Details: Orange Wave 2 appears to be completed; Orange Wave 3 is now active.
Wave Cancel Invalidation Level: 0.65280
The AUD/USD daily chart reveals an Elliott Wave analysis highlighting a bearish trend. The prevailing wave structure, identified as orange wave 3, is part of a larger impulsive sequence under navy blue wave 3.
Based on this analysis, orange wave 2 appears to have concluded, signaling the activation of orange wave 3. This development adheres to Elliott Wave Theory, which utilizes cyclical wave patterns to anticipate market movements. The progression of orange wave 3 reinforces the broader bearish outlook, suggesting continued downward momentum.
The invalidation level for this wave count is defined at 0.65280. A rise above this level would necessitate a re-evaluation of the wave structure, potentially signaling a deviation from the expected bearish scenario.
This analysis equips traders with a detailed understanding of market trends, emphasizing key levels and the impulsive nature of the ongoing wave. It underscores the likelihood of sustained bearish momentum in the days ahead.

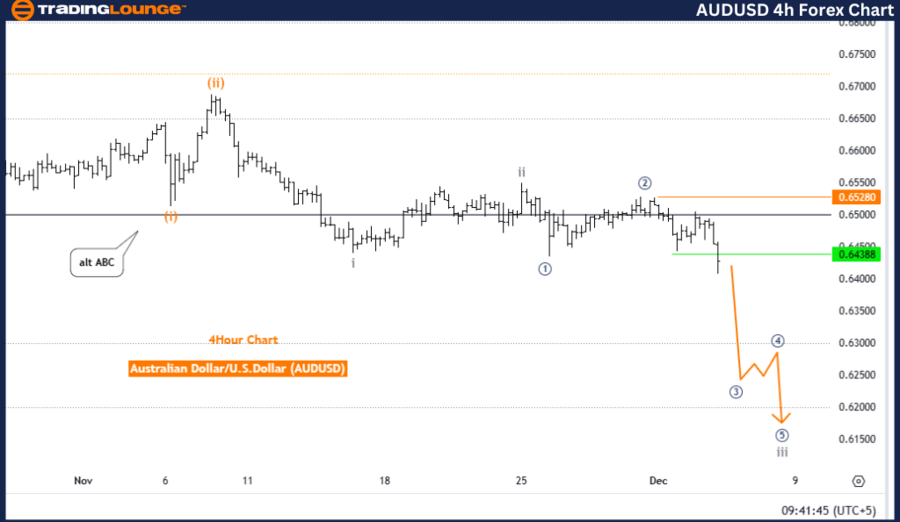
Australian Dollar/U.S. Dollar (AUDUSD) Elliott Wave Analysis - Trading Lounge 4-Hour Chart
AUDUSD Elliott Wave Technical Analysis
Function: Bearish Trend
Mode: Impulsive
Structure: Gray Wave 3
Position: Orange Wave 3
Direction Next Lower Degrees: Gray Wave 3 (Started)
Details: Gray Wave 2 appears to have completed; Gray Wave 3 is now active.
Wave Cancel Invalidation Level: 0.65533
The AUD/USD 4-hour chart presents an Elliott Wave analysis pointing to a bearish trend. The current wave structure, identified as gray wave 3, is unfolding within an impulsive sequence. Within this framework, orange wave 3 is active, reinforcing the downward trajectory.
The analysis suggests that gray wave 2 has likely completed, giving way to the progression of gray wave 3. This aligns with Elliott Wave Theory, which identifies repetitive wave patterns to forecast market trends. The ongoing bearish wave showcases the impulsive characteristics of this sequence, with further downside pressure anticipated.
The invalidation level for this wave count is set at 0.65533. A breach above this threshold would prompt a reassessment of the wave structure, signaling a possible shift from the expected bearish outlook.
This analysis offers traders a comprehensive perspective on the prevailing market dynamics. By highlighting significant levels and directional trends, it provides actionable insights into the continuation of bearish momentum in the near term.
Technical Analyst: Malik Awais
Source: visit Tradinglounge.com and learn From the Experts Join TradingLounge Here
Previous: EURUSD Elliott Wave Technical Analysis
VALUE Offer - Buy 1 Month & Get 3 Months!Click here
Access 7 Analysts Over 200 Markets Covered. Chat Room With Support
