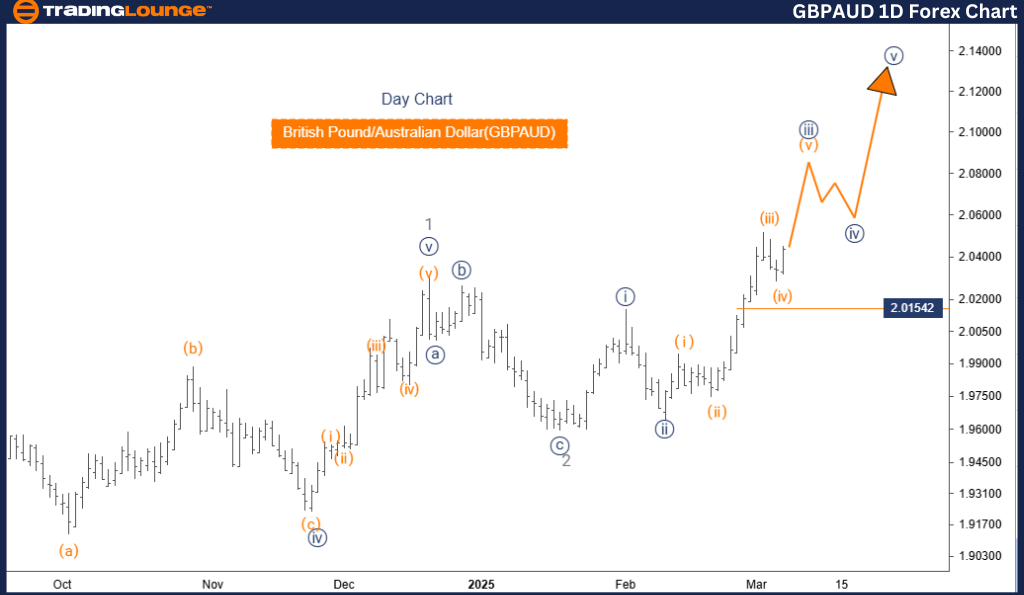
British Pound/Australian Dollar (GBPAUD) Elliott Wave Analysis – Trading Lounge Day Chart
GBPAUD Elliott Wave Technical Analysis
- Function: Bullish Trend
- Mode: Impulsive
- Structure: Navy Blue Wave 3
- Position: Gray Wave 3
- Next Lower Degree Direction: Navy Blue Wave 4
Market Overview
The GBPAUD Elliott Wave Analysis for the daily chart confirms a bullish trend, with the market moving in an impulsive phase. The price structure is currently positioned within navy blue wave 3, forming part of a broader gray wave 3 movement. This indicates a strong upward momentum, characteristic of an impulsive wave structure.
The next expected move at a lower degree is navy blue wave 4, which will likely emerge once navy blue wave 3 reaches its peak.
At present, navy blue wave 3 of 3 remains active, suggesting an extended bullish phase. This wave is expected to retain strong momentum, reflecting the impulsive nature of the trend. Traders should closely monitor navy blue wave 3, as its completion could indicate the beginning of navy blue wave 4, a potential corrective phase that may introduce temporary pullbacks or consolidation before the overall bullish trend resumes.
Key Level to Watch
- Wave Cancellation Invalid Level: 2.01542
If the price falls below 2.01542, the current wave count becomes invalid, signaling a necessary reevaluation of the wave structure. This level acts as a crucial support zone, and its breach may indicate a trend reversal or a shift in market direction.
Conclusion
The GBPAUD continues to maintain a bullish structure, with navy blue wave 3 of 3 nearing completion. This impulsive movement is part of a larger gray wave 3, and the next anticipated wave is navy blue wave 4.
Traders should pay close attention to the final stages of navy blue wave 3, as its completion will offer critical insights into the timing and direction of the upcoming corrective phase.
Understanding Elliott Wave structures is essential for anticipating price movements and aligning trading strategies effectively.
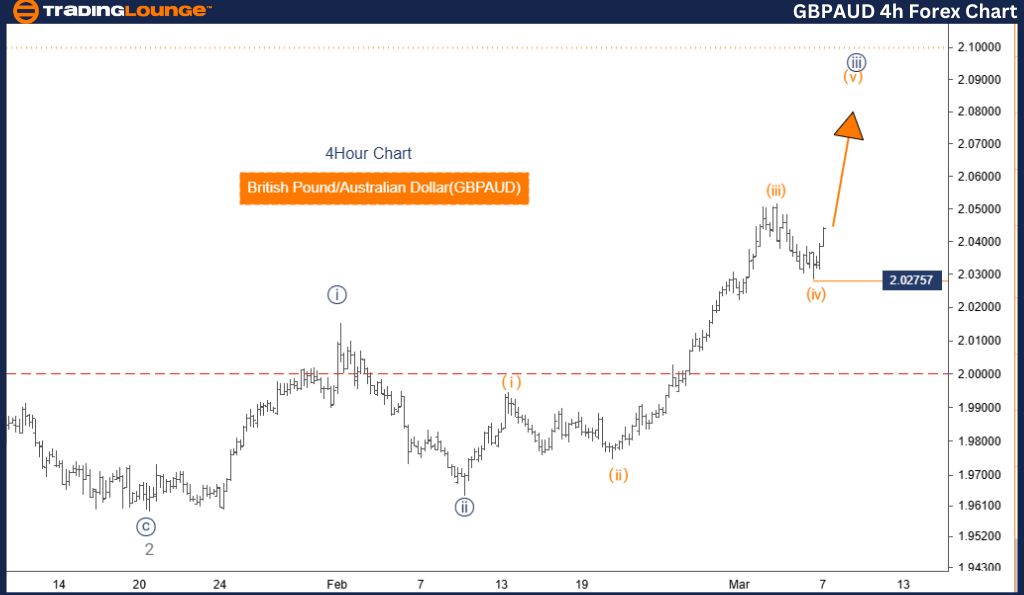
British Pound/Australian Dollar (GBPAUD) Elliott Wave Analysis – Trading Lounge Day Chart 4-Hour Chart Analysis
GBPAUD Elliott Wave Technical Analysis
Function: Bullish Trend
Mode: Impulsive
Structure: Orange Wave 5
Position: Navy Blue Wave 3
Next Lower Degree Direction: Navy Blue Wave 4
Market Overview
The GBPAUD Elliott Wave Analysis for the 4-hour chart indicates a bullish trend, with the market currently progressing through an impulsive phase. The price structure is identified as orange wave 5, which is part of the larger navy blue wave 3. This suggests continued upward momentum, characteristic of impulsive wave formations.
The next expected movement at a lower degree is navy blue wave 4, which should emerge once orange wave 5 is completed.
Current Wave Progression
The analysis suggests that orange wave 4 has concluded, and the market is now progressing within orange wave 5. This wave is expected to exhibit strong bullish momentum, reinforcing the impulsive trend. Traders should closely monitor orange wave 5, as its completion may signal the beginning of navy blue wave 4, a corrective phase that could introduce temporary price retracements or consolidation before the broader uptrend resumes.
Key Level to Watch
- Wave Cancellation Invalid Level: 2.02757
If the price drops below 2.02757, the current wave count will be invalidated, necessitating a market structure reassessment. This level acts as a critical support zone, and breaching it could indicate a trend reversal or wave count adjustment.
Conclusion
The GBPAUD remains in a bullish trend, with orange wave 5 actively progressing after the completion of orange wave 4. This impulsive wave forms part of navy blue wave 3, and the next major expected movement is navy blue wave 4.
Traders should closely track the completion of orange wave 5, as it will provide valuable insights into the timing and direction of the upcoming corrective wave.
A solid understanding of Elliott Wave structures is essential for anticipating price movements and optimizing trading strategies.
Technical Analyst: Malik Awais
Source: visit Tradinglounge.com and learn From the Experts Join TradingLounge Here
Previous: AUDUSD Elliott Wave Technical Analysis
VALUE Offer - Buy 1 Month & Get 3 Months!Click here
Access 7 Analysts Over 200 Markets Covered. Chat Room With Support