07May

Costco Wholesale Corp.(COST) Stocks Elliott Wave Technical Analysis: Focusing on both daily and 4-hour charts

COST Daily Elliott Wave Analysis

This comprehensive Elliott Wave analysis provides a current and future perspective on Costco Wholesale Corporation (COST), focusing on the potential price movements as indicated by the Elliott Wave theory on the daily and 4-hour charts as of May 7, 2024. Investors and traders can leverage this detailed insight to optimize their market positions.

Ticker: COST - Costco Wholesale Corp.

Costco Elliott Wave Technical Overview:

  • Function: Trend Identification
  • Mode: Impulsive Movements
  • Structure: Motive Phase
  • Position: Currently in Minor Wave 5
  • Direction: Anticipating Upside Movement in Minor 5

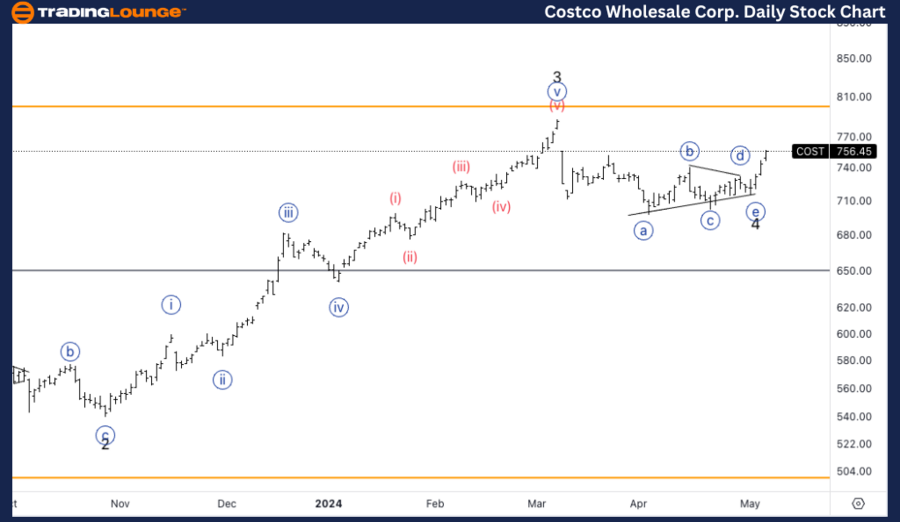
Detailed Analysis: The current Elliott Wave framework on the daily chart for Costco indicates that the stock is in the fifth minor wave of an impulsive sequence. As the stock approaches a critical price point, resistance is expected around the $800 mark. This level represents a significant trading milestone, termed as Trading Level 8. At this juncture, investors should watch for a potential completion of the fifth wave, characterized by a classic five-wave movement pattern within this terminal phase.

COST Elliott Wave Technical Analysis – Daily Chart

The daily chart of Costco reveals that the stock is currently in an impulsive, motive wave structure, specifically identified as Minor wave 5. This indicates an upward trend with expectations of continuing momentum. The analysis points out that the $800 price level, referred to as TradingLevel8, is expected to act as a significant resistance. In this phase, a five-wave structure within wave 5 is anticipated to unfold, suggesting sustained upward movement.

Costco-1D-Stock-char...


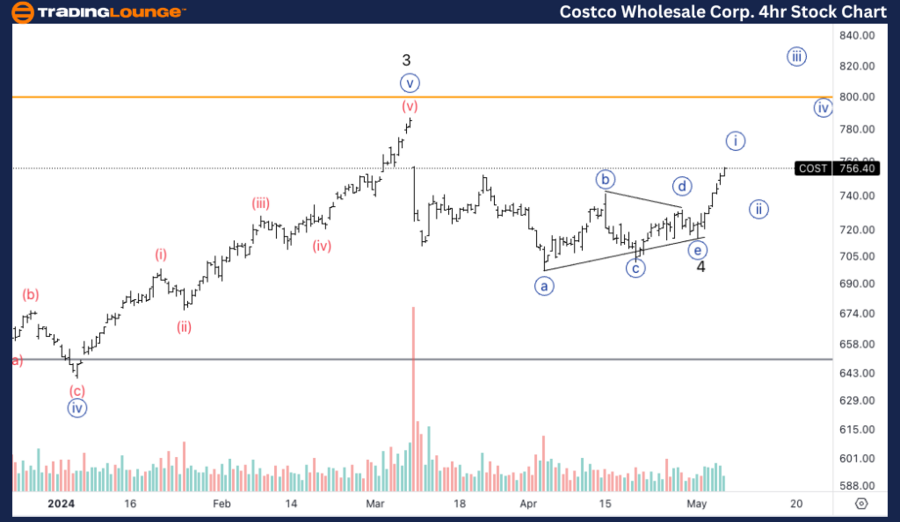
COST 4-Hour Elliott Wave Analysis

Ticker: COST - Costco Wholesale Corp.

COST Elliott Wave Technical Overview:

  • Function: Trend Identification
  • Mode: Impulsive Movements
  • Structure: Motive Phase
  • Position: Wave {i} of 5
  • Direction: Currently experiencing a Pullback in Wave {ii}

Detailed Analysis: In the shorter time frame of the 4-hour chart, Costco's stock demonstrates a temporary pullback within the broader bullish trend, situated in wave {ii} of the final fifth wave. This retracement phase is a typical occurrence in Elliott Wave theory, where after a strong initial wave {i}, the stock adjusts before resuming its primary direction. The current support level at $720 is crucial as it represents a potential turnaround point for the stock to rebound and continue its ascent, targeting longer positions once the pullback consolidates.

COST Elliott Wave Technical Analysis – 4H Chart

Zooming into the 4-hour chart, Costco is currently positioned in Wave {i} of Minor 5, and a pullback in Wave {ii} is expected. This pullback presents a strategic entry point for traders, with the stock finding preliminary support at the $720 level. Following this correction, a continuation higher in Wave {iii} is likely.

Technical Analyst: Alessio Barretta

Source: visit Tradinglounge.com and learn From the Experts Join TradingLounge Here 

See Previous: Texas Instruments Inc.(TXN) Stocks 

Special Trial Offer - 0.76 Cents a Day for 3 Months! Click here

Access 6 Analysts covering over 150 Markets. Chat Room With Support

Costco-4h-Stock-char...

Related

British Pound/ U.S. Dollar (GBPUSD) Elliott Wave Analysis: Bullish Wave 3 Progression with Key Invalidation Level at 1.31425

British Pound/ U.S. Dollar (GBPUSD) Elliott Wave Analysis: Bullish Wave 3 Progression with Key Invalidation Level at 1.31425

The GBPUSD pair is exhibiting a bullish trend, currently in Wave 3 according to Elliott Wave analysi...

Read More >
NEO’s Crypto Market Trends with Accurate Forecasts and Actionable Plans: NEOUSD Elliott Wave Technical Analysis

NEO’s Crypto Market Trends with Accurate Forecasts and Actionable Plans: NEOUSD Elliott Wave Technical Analysis

This analysis provides an in-depth look at NEOUSD using Elliott Wave theory, offering key insights i...

Read More >
Expert Technical Analysis for Optimal Trading: WiseTech Global Limited (ASX: WTC) Elliott Wave Analysis

Expert Technical Analysis for Optimal Trading: WiseTech Global Limited (ASX: WTC) Elliott Wave Analysis

Explore our detailed Elliott Wave analysis of WiseTech Global Limited (ASX: WTC). Understand current...

Read More >
Elliott Wave Analysis for NASDAQ Tech Stocks: Identifying Potential Bottoms and Long Trade Setups

Elliott Wave Analysis for NASDAQ Tech Stocks: Identifying Potential Bottoms and Long Trade Setups

The SP500 and NASDAQ have shown signs of a possible bottom following a recent correction. NVDA, amon...

Read More >
British Pound/ U.S. Dollar Forex Pair and GBPUSD Elliott Wave Technical Analysis: Daily and 4H Chart for Trading Setup Opportunities

British Pound/ U.S. Dollar Forex Pair and GBPUSD Elliott Wave Technical Analysis: Daily and 4H Chart for Trading Setup Opportunities

The GBPUSD daily and 4-hour charts show a counter-trend Wave 2 correction within a broader bearish E...

Read More >

$1 for 2 Weeks

then $29 a month!

What a Special Offer!

Trade Recommendations

Unleash the power of deversified trading with our comprehensive portfolio, covering 250+ markets:

  • Stock Trades
  • Crypto Trades
  • Forex Trades
  • Commodity Trades
Elliott Wave Analysis

Gain a competitive edge with expert insights and AI-powered Elliott Wave charting into:

  • Global Indices
  • US Stocks & ASX Stocks
  • Forex & Crypto
  • Commodities
Top-Notch Trading Tools

Equip yourself with the tools of success:

  • Real-time Chat rooms
  • Elliott Wave Algorithm
  • Portfolio tools
  • TradingLevels
  • Screener
  • Trading Game
7 Elliott Wave Analysts

Stay ahead of the market with daily charts and insightful videos
Your secret to strategic trading!

JOIN HERE


Welcome to TradingLounge (ASIC A.R.No. 321187), specialists in trades, trading education and technical analysis, covering stocks, indices, commodities, forex and cryptocurrencies.

When you join TradingLounge you have access to everything we offer, including trade tools, educational content and a social platform to chat with like-minded investors.

Read more

@Copyright 2024 by tradinglounge.com

Contact Us

Australian no: 02 4787 6020

International no: +61 (2) 47876020

Pay with:

Find us on