07Jul

Russell 2000 Elliott Wave Forecast Highlights Bullish Trend, Wave Structure Progression, and Key Invalidation Levels for Technical Traders

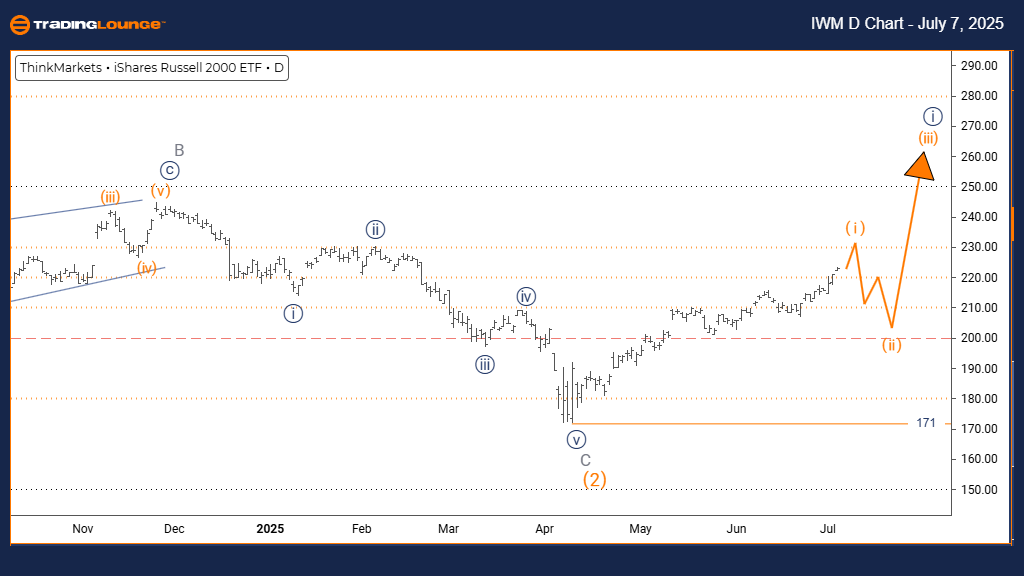
RUSSELL 2000 Elliott Wave Analysis | Trading Lounge Day Chart

RUSSELL 2000 Elliott Wave Technical Analysis

Function: Bullish Trend

Mode: Impulsive

Structure: Orange Wave 1

Position: Navy Blue Wave 1

Direction Next Lower Degrees: Orange Wave 2

Details: Orange Wave 1 of Navy Blue Wave 1 is currently forming within a developing uptrend.

Wave Cancel Invalidation Level: 171

The Russell 2000 index daily chart reflects a bullish Elliott Wave structure, confirming a strong impulsive rally. The current formation—Orange Wave 1 within Navy Blue Wave 1—suggests the start of a broader upward cycle, indicating early momentum in a new bullish trend.

As Orange Wave 1 unfolds, it supports a foundation for continued price appreciation. The upcoming wave—Orange Wave 2—is expected to be a corrective phase, which often presents strategic buying opportunities before the rally resumes.

A key technical reference is the wave invalidation level at 171. If prices retreat to this level, it would invalidate the current wave count, necessitating a revised Elliott Wave analysis. Traders should monitor this support closely to align risk and entry strategies.

With current wave dynamics pointing upward, the technical landscape favors bullish trading setups. Identifying confirmation signals and managing trades relative to the invalidation level enhances trading precision as the trend matures.

RUSSELL-d-index-char...


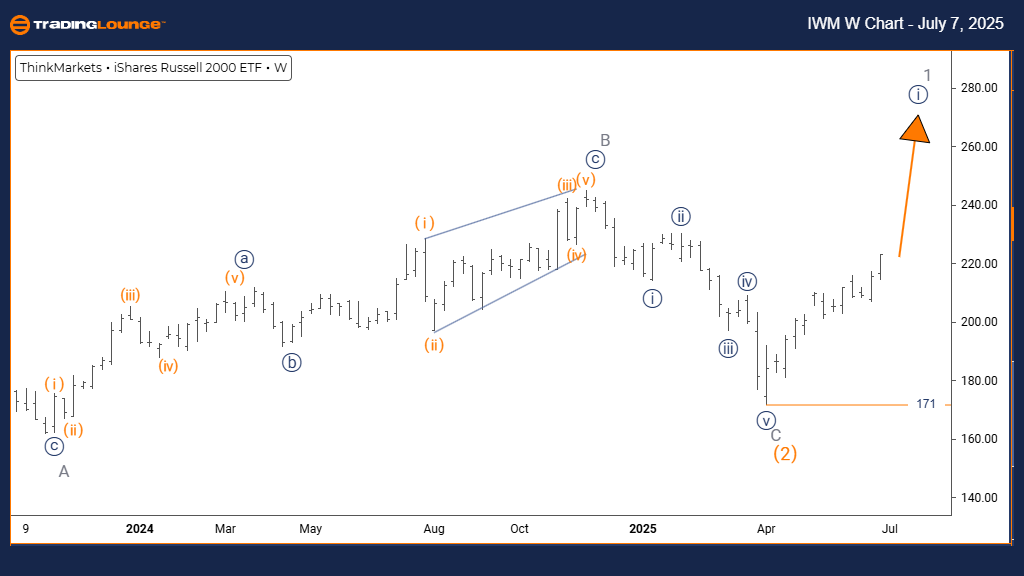
RUSSELL 2000 Elliott Wave Analysis | Trading Lounge Weekly Chart

RUSSELL 2000 Elliott Wave Technical Analysis

Function: Bullish Trend

Mode: Impulsive

Structure: Navy Blue Wave 1

Position: Gray Wave 1

Direction Next Lower Degrees: Navy Blue Wave 2

Details: Orange Wave 2 appears completed; Navy Blue Wave 1 of 1 is currently forming.

Wave Cancel Invalidation Level: 171

On the Russell 2000 weekly chart, Elliott Wave analysis confirms a strong bullish market structure in impulsive mode. The current movement—Navy Blue Wave 1 inside Gray Wave 1—marks the onset of a potentially sustained upward trend.

With Orange Wave 2 likely completed, the market is progressing through Navy Blue Wave 1, suggesting the first phase of a long-term bullish cycle. This phase is expected to continue until the next correction, identified as Navy Blue Wave 2, emerges.

The wave invalidation threshold at 171 remains pivotal. A move to this level would signal a break in the current bullish count and prompt a reevaluation of the trend. This level is essential for managing trade risk and directional bias.

Overall, the structure indicates favorable conditions for long-term bullish positions. Investors and traders should monitor price action for confirmation of trend continuation and leverage strategic entries while respecting the invalidation level for sound risk management.

Technical Analyst: Malik Awais

Source: Visit Tradinglounge.com and learn from the Experts. Join TradingLounge Here

Previous: Bovespa Index Elliott Wave Technical Analysis

VALUE Offer - Buy 1 Month & Get 3 Months!Click here

Access 7 Analysts Over 200 Markets Covered. Chat Room With Support

RUSSELL-w-index-char...

Related

Bitcoin/U.S. dollar(BTCUSD) Elliott Wave Technical Analysis 17 October 23

Bitcoin/U.S. dollar(BTCUSD) Elliott Wave Technical Analysis 17 October 23

Trading lounge Bitcoin/U.S. dollar(BTCUSD) Elliott Wave Technical Analysis 4-hour and day charts for...

Read More >
Costco Wholesale Corp.(COST:NASDAQ) Elliott Wave Technical Analysis 1 November 23

Costco Wholesale Corp.(COST:NASDAQ) Elliott Wave Technical Analysis 1 November 23

Costco Wholesale Corp.(COST: NASDAQ) Elliott Wave Technical Analysis confirming the overall upside t...

Read More >
Alphabet Inc.(GOOGL) Stocks Elliott Wave Technical Analysis To Identify Key Entry and Exit Points While Monitoring Market Trends

Alphabet Inc.(GOOGL) Stocks Elliott Wave Technical Analysis To Identify Key Entry and Exit Points While Monitoring Market Trends

This GOOGL Elliott Wave Analysis explores Alphabet Inc.'s stock trends using the Elliott Wave Th...

Read More >
Gold XAUUSD Elliott Wave Technical Analysis to Predict Gold Price Movements and Stay ahead in the Commodity Market

Gold XAUUSD Elliott Wave Technical Analysis to Predict Gold Price Movements and Stay ahead in the Commodity Market

This article provides an in-depth Elliott Wave analysis of the Gold market. It covers the ongoing bu...

Read More >
NEOUSD Elliott Wave Analysis: Bullish Setup for Wave (3) | NEO Price Prediction and Swing Trade Strategies for Crypto Traders

NEOUSD Elliott Wave Analysis: Bullish Setup for Wave (3) | NEO Price Prediction and Swing Trade Strategies for Crypto Traders

NEOUSD is stabilising after a major decline, setting up a bullish Elliott Wave (3) rally. Learn key ...

Read More >
Utilizing both Daily and 4-hour Charts: JP Morgan & Chase Co. (JPM) Stocks Elliott Wave Technical Analysis

Utilizing both Daily and 4-hour Charts: JP Morgan & Chase Co. (JPM) Stocks Elliott Wave Technical Analysis

Our latest Elliott Wave analysis for JP Morgan Chase (JPM) provides comprehensive insights into the ...

Read More >

$1 for 2 Weeks

then $29 a month!

What a Special Offer!

Trade Recommendations

Unleash the power of deversified trading with our comprehensive portfolio, covering 250+ markets:

  • Stock Trades
  • Crypto Trades
  • Forex Trades
  • Commodity Trades
Elliott Wave Analysis

Gain a competitive edge with expert insights and AI-powered Elliott Wave charting into:

  • Global Indices
  • US Stocks & ASX Stocks
  • Forex & Crypto
  • Commodities
Top-Notch Trading Tools

Equip yourself with the tools of success:

  • Real-time Chat rooms
  • Elliott Wave Algorithm
  • Portfolio tools
  • TradingLevels
  • Screener
  • Trading Game
7 Elliott Wave Analysts

Stay ahead of the market with daily charts and insightful videos
Your secret to strategic trading!

JOIN HERE


Welcome to TradingLounge (ASIC A.R.No. 321187), specialists in trades, trading education and technical analysis, covering stocks, indices, commodities, forex and cryptocurrencies.

When you join TradingLounge you have access to everything we offer, including trade tools, educational content and a social platform to chat with like-minded investors.

Read more

@Copyright 2024 by tradinglounge.com

Contact Us

Australian no: 02 4787 6020

International no: +61 (2) 47876020

Pay with:

Find us on