SPOT Elliott Wave Analysis: Spotify Technology S.A. (SPOT) – Daily and 1-Hour Chart Overview

This analysis explores the technical movements of Spotify Technology S.A. (SPOT) based on both the daily and 1-hour charts. Using the Elliott Wave Theory, this evaluation focuses on current market trends and potential future price shifts.

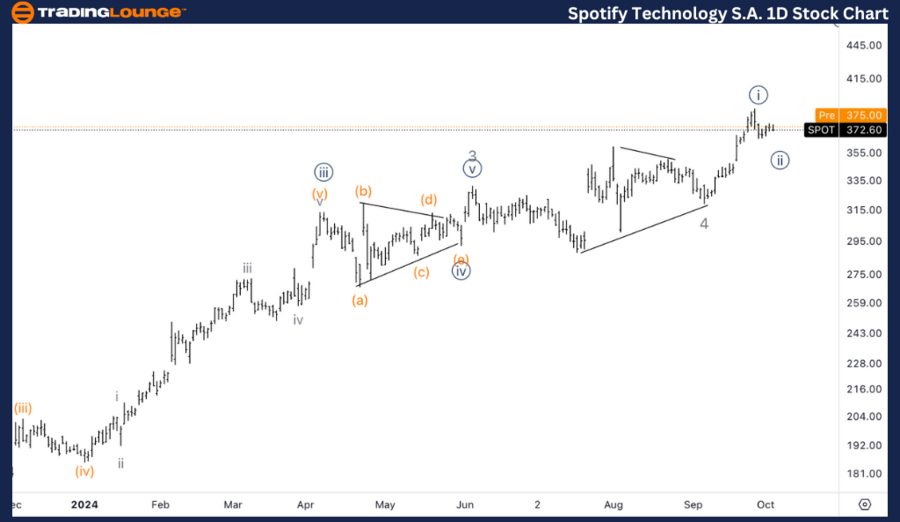
SPOT Elliott Wave Analysis – TradingLounge Daily Chart

Spotify Technology S.A. (SPOT) Daily Chart Overview

SPOT Elliott Wave Technical Analysis

Function: Trend

Mode: Impulsive

Structure: Motive

Position: Wave 5

Direction: Completing Wave 5

Details: SPOT is currently trading within MinorGroup2 of the $300 level, specifically in the range between $372 and $380. The stock is expected to see further upward movement, targeting the next TradingLevel at $500 as it completes Wave 5.

SPOT Elliott Wave Technical Analysis – Daily Chart Overview

On the daily chart, SPOT is moving through Wave 5 of an impulsive structure. The stock is currently trading between $372 and $380 within MinorGroup2. The next key target is TradingLevel 500, indicating significant potential for further upside as SPOT progresses through the final stages of Wave 5.

Traders should monitor potential consolidations as SPOT approaches important psychological milestones like $400. Despite the possibility of pullbacks, the overall bullish momentum suggests continued upward potential, with $500 as the next major resistance level.

Spotify-Technology-S...


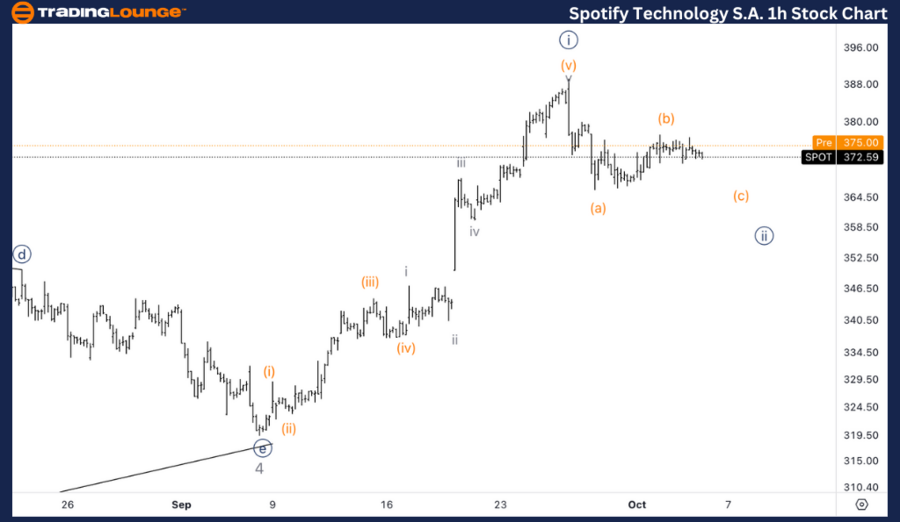
SPOT Elliott Wave Analysis – 1-Hour Chart

Spotify Technology S.A. (SPOT) 1-Hour Chart Overview

SPOT Elliott Wave Technical Analysis

Function: Trend

Mode: Impulsive

Structure: Motive

Position: Wave {i} of 5

Direction: Seeking a bottom in Wave {ii}

Details: SPOT is currently seeking a bottom in Wave {ii} of 5, with expectations for a resumption of upward movement within Minor Wave 5 once Wave {ii} finds its bottom.

SPOT Elliott Wave Technical Analysis – 1-Hour Chart Overview

On the 1-hour chart, SPOT is in the early stages of Wave 5 and forming Wave {ii}. Once a bottom in Wave {ii} is confirmed, SPOT is expected to resume its upward trajectory within Wave 5, providing a potential buying opportunity for traders looking to capitalize on the next upward movement.

The immediate upside target is around $400, with a longer-term extension expected toward $500 as the stock completes Wave 5.

Technical Analyst: Alessio Barretta

Source: visit Tradinglounge.com and learn From the Experts Join TradingLounge Here 

See Previous: NextEra Energy Inc Elliott Wave Technical Analysis

VALUE Offer - Buy 1 Month & Get 3 Months!Click here

Access 7 Analysts Over 200 Markets Covered. Chat Room With Support

Spotify-Technology-S...

Related

AAVE/ U.S. dollar(AAVEUSD) Elliott Wave Technical Analysis: Explore the corrective phase within the Zigzag pattern

AAVE/ U.S. dollar(AAVEUSD) Elliott Wave Technical Analysis: Explore the corrective phase within the Zigzag pattern

In this Elliott Wave analysis and trading strategy overview for AAVE/USD (AAVEUSD) on February 26, w...

Read More >
Berkshire Hathaway Inc.(BRK.B:NYSE) Elliott Wave Technical Analysis 30 October 23

Berkshire Hathaway Inc.(BRK.B:NYSE) Elliott Wave Technical Analysis 30 October 23

Berkshire Hathaway Inc.(BRK.B:NYSE) Elliott Wave Technical Analysis 30 October 23, Stock Market Anal...

Read More >
Elliott Wave Analysis for ASX Unibail-Rodamco-Westfield: Reveals Bullish Fifth Wave Structure and Medium-Term Stock Forecast

Elliott Wave Analysis for ASX Unibail-Rodamco-Westfield: Reveals Bullish Fifth Wave Structure and Medium-Term Stock Forecast

Elliott Wave analysis reviews URW stock on the ASX, showing medium-term bullish potential. Wave stru...

Read More >
Bitcoin (BTCUSD) Elliott Wave 3 Forecast: Swing Trade Setup & Price Targets with Key Support, Breakout Alert & Invalidation Level

Bitcoin (BTCUSD) Elliott Wave 3 Forecast: Swing Trade Setup & Price Targets with Key Support, Breakout Alert & Invalidation Level

Elliott Wave breakdown for BTCUSD targeting wave 3 upside. Includes correction zones at $107.2K–$10...

Read More >
Natural Gas Commodity Elliott Wave Technical Analysis: Market Trends and Strategic Insights

Natural Gas Commodity Elliott Wave Technical Analysis: Market Trends and Strategic Insights

This article provides an in-depth natural gas Elliott Wave analysis, highlighting current bearish tr...

Read More >
NIKKEI 225 Index Elliott Wave Technical Analysis: Understanding the Current Corrective Phase and Future Projections

NIKKEI 225 Index Elliott Wave Technical Analysis: Understanding the Current Corrective Phase and Future Projections

This article provides a detailed Elliott Wave analysis of the NIKKEI 225, examining the current corr...

Read More >

$1 for 2 Weeks

then $29 a month!

What a Special Offer!

Trade Recommendations

Unleash the power of deversified trading with our comprehensive portfolio, covering 250+ markets:

  • Stock Trades
  • Crypto Trades
  • Forex Trades
  • Commodity Trades
Elliott Wave Analysis

Gain a competitive edge with expert insights and AI-powered Elliott Wave charting into:

  • Global Indices
  • US Stocks & ASX Stocks
  • Forex & Crypto
  • Commodities
Top-Notch Trading Tools

Equip yourself with the tools of success:

  • Real-time Chat rooms
  • Elliott Wave Algorithm
  • Portfolio tools
  • TradingLevels
  • Screener
  • Trading Game
7 Elliott Wave Analysts

Stay ahead of the market with daily charts and insightful videos
Your secret to strategic trading!

JOIN HERE


Welcome to TradingLounge (ASIC A.R.No. 321187), specialists in trades, trading education and technical analysis, covering stocks, indices, commodities, forex and cryptocurrencies.

When you join TradingLounge you have access to everything we offer, including trade tools, educational content and a social platform to chat with like-minded investors.

Read more

@Copyright 2024 by tradinglounge.com

Contact Us

Australian no: 02 4787 6020

International no: +61 (2) 47876020

Pay with:

Find us on