31Oct

Berkshire Hathaway Inc.(BRK.B:NYSE) Elliott Wave Technical Analysis 30 October 23

Berkshire Hathaway Inc., Elliott Wave Technical Analysis

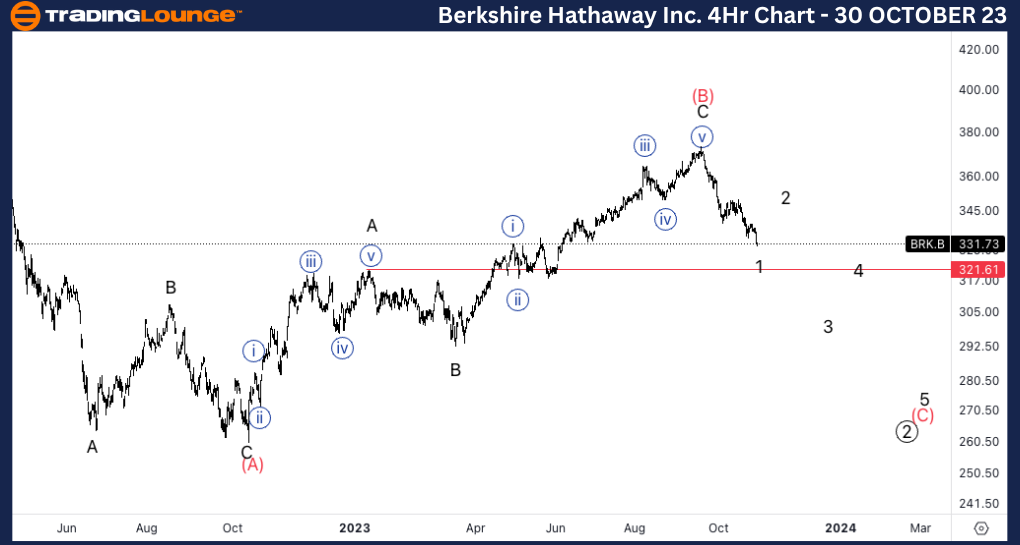
Berkshire Hathaway Inc., (BRK.B:NYSE): 4H Chart 30 October 23

BRK.B Stock Market Analysis: Looking for a different count as we have approached invalidation level and it looks like we are going to move through. Looking for a flat wave 2 as we seem to have a three wave move to the upside into wave (B).

BRK.B Elliott Wave Count: Wave (B) of 2.

BRK.B Technical Indicators: Below all averages, 20 and 200EMA crossed(bearish signal).  

BRK.B Trading Strategy: Looking shorts into wave (C).

TradingLounge Analyst: Alessio Barretta

Source: Tradinglounge.com get trial here!

BRKB-Stock-4Hr-Chart...


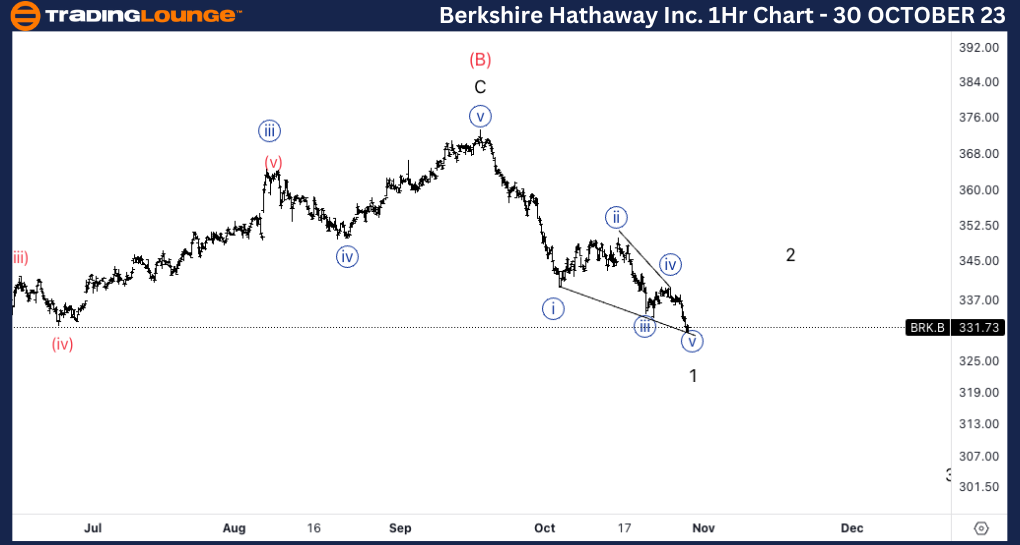
Berkshire Hathaway Inc., BRK.B: 1-hour Chart 30 October 23

Berkshire Hathaway Inc., Elliott Wave Technical Analysis

BRK.B Stock Market Analysis: Looking for a potential leading diagonal into wave 1 as RSI seems to be suggesting too, to then pullback in wave 2 where we could look for potential shorts.  

BRK.B Elliott Wave count: Wave 1 of (C).

BRK.B Technical Indicators: Below all averages.

BRK.B Trading Strategy: Looking for shorts into wave 3 if we get a pullback in wave 2.

BRKB-Stock-1Hr-Chart...

Related

Cocoa Commodity Elliott Wave Technical Analysis: Market Trends, and Trading Insights for Wave B and Wave C Forecasts

Cocoa Commodity Elliott Wave Technical Analysis: Market Trends, and Trading Insights for Wave B and Wave C Forecasts

Gain valuable insights into cocoa price movements with Elliott Wave analysis. Explore the projected ...

Read More >
USDCHF Elliott Wave Technical Breakdown: Bearish Impulsive Wave 3 and Corrective Phase Insights for Smart Trading

USDCHF Elliott Wave Technical Breakdown: Bearish Impulsive Wave 3 and Corrective Phase Insights for Smart Trading

This analysis delivers a detailed breakdown of the USDCHF currency pair using Elliott Wave principle...

Read More >
TASI Index Elliott Wave Analysis Forecasts Strong Bullish Move in Saudi Market with Impulsive Gray Wave 3 Structure

TASI Index Elliott Wave Analysis Forecasts Strong Bullish Move in Saudi Market with Impulsive Gray Wave 3 Structure

Elliott Wave analysis of the TASI Index highlighting an impulsive bullish trend through Gray Wave 3 ...

Read More >
WIPRO Stocks Elliott Wave Technical Analysis: Learn How Wave Counts and Projections Can Guide Your Trading Decisions

WIPRO Stocks Elliott Wave Technical Analysis: Learn How Wave Counts and Projections Can Guide Your Trading Decisions

This article dives into the Elliott Wave analysis of Wipro, providing a comprehensive breakdown of i...

Read More >

$1 for 2 Weeks

then $29 a month!

What a Special Offer!

Trade Recommendations

Unleash the power of deversified trading with our comprehensive portfolio, covering 250+ markets:

  • Stock Trades
  • Crypto Trades
  • Forex Trades
  • Commodity Trades
Elliott Wave Analysis

Gain a competitive edge with expert insights and AI-powered Elliott Wave charting into:

  • Global Indices
  • US Stocks & ASX Stocks
  • Forex & Crypto
  • Commodities
Top-Notch Trading Tools

Equip yourself with the tools of success:

  • Real-time Chat rooms
  • Elliott Wave Algorithm
  • Portfolio tools
  • TradingLevels
  • Screener
  • Trading Game
7 Elliott Wave Analysts

Stay ahead of the market with daily charts and insightful videos
Your secret to strategic trading!

JOIN HERE


Welcome to TradingLounge (ASIC A.R.No. 321187), specialists in trades, trading education and technical analysis, covering stocks, indices, commodities, forex and cryptocurrencies.

When you join TradingLounge you have access to everything we offer, including trade tools, educational content and a social platform to chat with like-minded investors.

Read more

@Copyright 2024 by tradinglounge.com

Contact Us

Australian no: 02 4787 6020

International no: +61 (2) 47876020

Pay with:

Find us on