02Jul

TASI Index Elliott Wave Analysis Forecasts Strong Bullish Move in Saudi Market with Impulsive Gray Wave 3 Structure

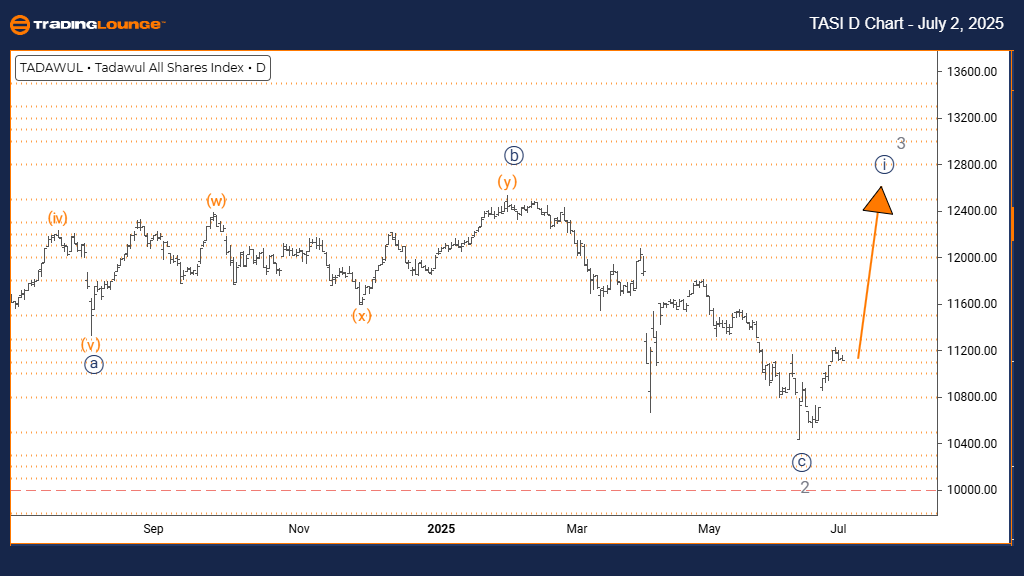
TASI INDEX – Elliott Wave Analysis (Daily Chart)  – Trading Lounge

TASI Technical Analysis Overview

FUNCTION: Bullish Trend

MODE: Impulsive

STRUCTURE: Navy Blue Wave 1

POSITION: Gray Wave 3

NEXT LOWER DEGREE DIRECTION: Navy Blue Wave 2

DETAILS: Completion of Gray Wave 2 appears confirmed. Navy Blue Wave 1 of 3 has started.

The TASI INDEX daily chart indicates a bullish Elliott Wave structure, with price movement showing an impulsive trend upward. The market is currently forming Navy Blue Wave 1, embedded within a broader Gray Wave 3 sequence. This configuration points to the initiation of a stronger upward cycle.

With Gray Wave 2 completed, the trend suggests the beginning of Navy Blue Wave 1 of 3, part of a classic Elliott Wave impulse. A corrective phase (Navy Blue Wave 2) is expected after the current wave finalizes, preparing for the continuation of the long-term bullish momentum.

Technical signals support this upward trend. Strong buying interest underlines the momentum, reinforcing the Gray Wave 3 advance and suggesting the TASI INDEX is positioned for continued growth.

TASI-D-INDEX-CHART-0...


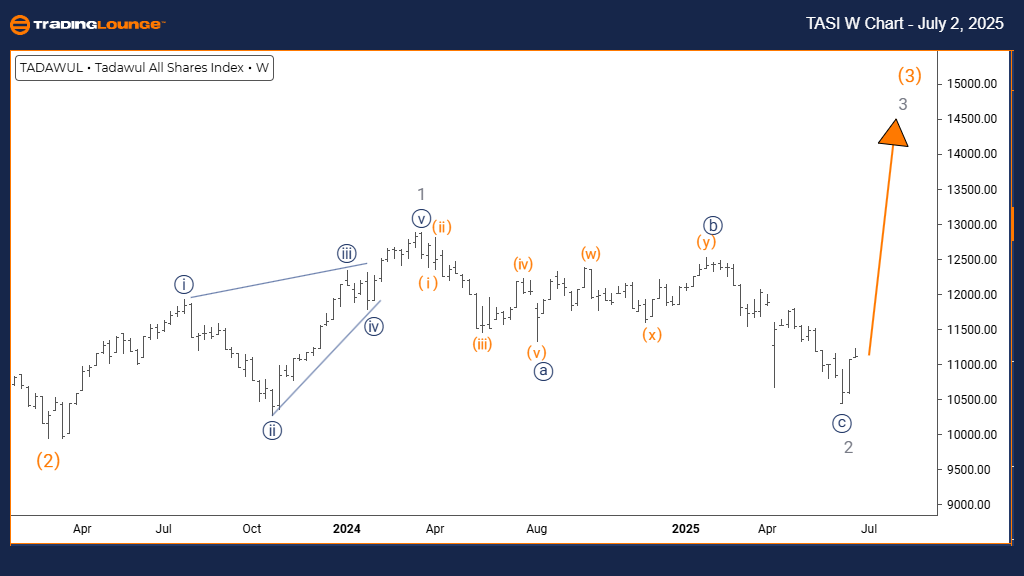
TASI INDEX – Elliott Wave Analysis (Weekly Chart)  – Trading Lounge

TASI  Technical Analysis Overview

FUNCTION: Bullish Trend

MODE: Impulsive

STRUCTURE: Gray Wave 3

POSITION: Orange Wave 3

NEXT HIGHER DEGREE DIRECTION: Gray Wave 3 (In Progress)

DETAILS: Gray Wave 2 likely completed. Gray Wave 3 of Orange Wave 3 is developing.

The weekly chart of the TASI INDEX confirms a strong bullish Elliott Wave pattern. The current formation marks the expansion of Gray Wave 3 within Orange Wave 3, commonly associated with aggressive bullish runs. The impulsive setup signals the market is in a high-momentum growth phase.

As Gray Wave 2 concludes, market action indicates Gray Wave 3 of 3 is unfolding—often the most powerful segment in an Elliott Wave sequence. This wave typically experiences rapid price movement with minimal pullbacks.

Technical analysis suggests a supportive framework for ongoing upside. The TASI INDEX forecast remains optimistic, with room for strong bullish continuation in the next stages of Gray Wave 3.

Technical Analyst: Malik Awais

Source: Visit Tradinglounge.com and learn from the Experts. Join TradingLounge Here

Previous: Shanghai Composite Elliott Wave Technical Analysis

VALUE Offer - Buy 1 Month & Get 3 Months!Click here

Access 7 Analysts Over 200 Markets Covered. Chat Room With Support

TASI-W-INDEX-CHART-0...

Related

Cardano (ADAUSD) Elliott Wave Analysis: Resistance & Support Levels, Crypto Market Trends, and Technical Analysis

Cardano (ADAUSD) Elliott Wave Analysis: Resistance & Support Levels, Crypto Market Trends, and Technical Analysis

Elliott Wave Analysis of ADA/USD, highlighting Cardano's price projections, technical analysis, ...

Read More >
Dogecoin Crypto Price News Today Elliott Wave Technical Analysis To Enhance Your Cryptocurrency Trading

Dogecoin Crypto Price News Today Elliott Wave Technical Analysis To Enhance Your Cryptocurrency Trading

This article provides an in-depth Elliott Wave analysis of Dogecoin (DOGEUSD), offering insights int...

Read More >
McDonald’s Corp.(MCD) MCD Elliott Wave Technical Analysis 29 January 24

McDonald’s Corp.(MCD) MCD Elliott Wave Technical Analysis 29 January 24

McDonald’s Corp.(MCD) MCD Elliott Wave Technical Analysis dated 29 January 24, MCD Elliott Wave Ana...

Read More >
An in-depth look at The TJX Companies Inc.(TJX) Stocks Technical Analysis through the lens of Elliott Wave theory

An in-depth look at The TJX Companies Inc.(TJX) Stocks Technical Analysis through the lens of Elliott Wave theory

This analysis provides an in-depth look at TJX Companies Inc. through the lens of Elliott Wave theor...

Read More >
ASX WTC stock market trends and effective trading strategies Using: Wisetech Global Limited Elliott Wave Technical Forecast

ASX WTC stock market trends and effective trading strategies Using: Wisetech Global Limited Elliott Wave Technical Forecast

Our detailed Elliott Wave analysis of WISETECH GLOBAL LIMITED (WTC) provides valuable insights into ...

Read More >
Texas Instruments Inc. Stock Analysis - TXN Elliott Wave Technical Analysis Shows key resistance levels and Stock Movements

Texas Instruments Inc. Stock Analysis - TXN Elliott Wave Technical Analysis Shows key resistance levels and Stock Movements

This analysis provides a detailed look at Texas Instruments Inc. (TXN) through the lens of Elliott W...

Read More >

$1 for 2 Weeks

then $29 a month!

What a Special Offer!

Trade Recommendations

Unleash the power of deversified trading with our comprehensive portfolio, covering 250+ markets:

  • Stock Trades
  • Crypto Trades
  • Forex Trades
  • Commodity Trades
Elliott Wave Analysis

Gain a competitive edge with expert insights and AI-powered Elliott Wave charting into:

  • Global Indices
  • US Stocks & ASX Stocks
  • Forex & Crypto
  • Commodities
Top-Notch Trading Tools

Equip yourself with the tools of success:

  • Real-time Chat rooms
  • Elliott Wave Algorithm
  • Portfolio tools
  • TradingLevels
  • Screener
  • Trading Game
7 Elliott Wave Analysts

Stay ahead of the market with daily charts and insightful videos
Your secret to strategic trading!

JOIN HERE


Welcome to TradingLounge (ASIC A.R.No. 321187), specialists in trades, trading education and technical analysis, covering stocks, indices, commodities, forex and cryptocurrencies.

When you join TradingLounge you have access to everything we offer, including trade tools, educational content and a social platform to chat with like-minded investors.

Read more

@Copyright 2024 by tradinglounge.com

Contact Us

Australian no: 02 4787 6020

International no: +61 (2) 47876020

Pay with:

Find us on