09Dec

Bajaj Finserve Stock Analysis: Elliott Wave Insights, Daily & 4H Chart Review, Price Forecasts, Corrective Waves, and Investment Trends

BAJAJ FINSERVE – BAJAJFINSV (1D Chart) Elliott Wave Technical Analysis

BAJAJFINSV Elliott Wave Technical Analysis

Function: Counter Trend (Minor degree Grey)

Mode: Corrective

Structure: Impulse within larger degree correction.

Position: Minor Wave 1 Grey

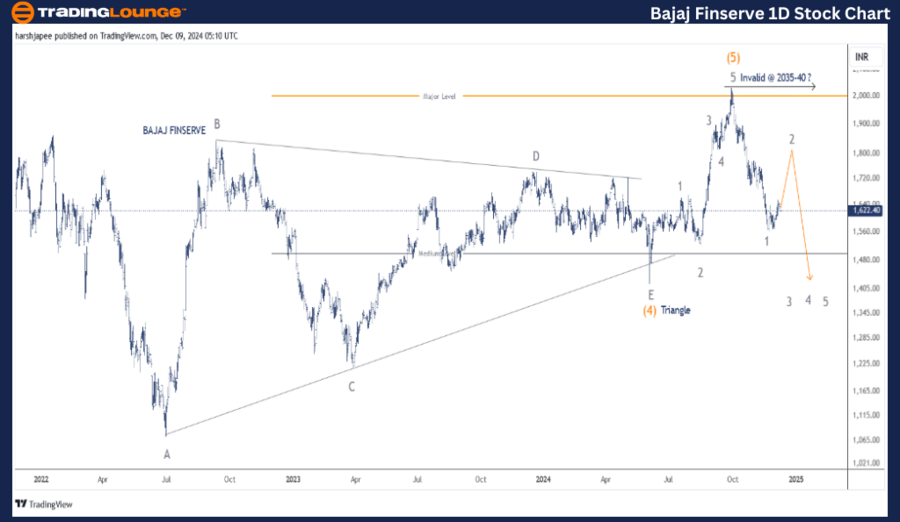
Details: Minor Wave 1 appears to have completed below 1600. If correct, Minor Wave 2 rally may target the 1800 level before bearish momentum resumes.

Invalidation point: 2040

BAJAJ FINSERVE Daily Chart Technical Analysis and Potential Elliott Wave Counts

The daily chart of BAJAJ FINSERVE suggests a likely trend reversal below the 2040 high recorded in September 2024. The larger degree uptrend seems to have concluded, with bearish forces working towards completing the first impulse wave lower, potentially in the 1400-1550 range.

Previously, the stock exhibited a larger triangle consolidation phase from July 2022 to June 2024, with Intermediate Wave (4) Orange terminating near 1420. Bulls concluded Intermediate Wave (5) as a thrust impulse wave, followed by a sharp price reversal.

Assuming this analysis holds, the price action might breach the 1400 mark in the short term before a counter-trend rally emerges.

BAJAJ-FINSERVE-1d-st...


BAJAJ FINSERVE – BAJAJFINSV (4H Chart) Elliott Wave Technical Analysis

Function: Counter Trend (Minor degree Grey)

Mode: Corrective

Structure: Impulse within larger degree correction.

Position: Minor Wave 1 Grey

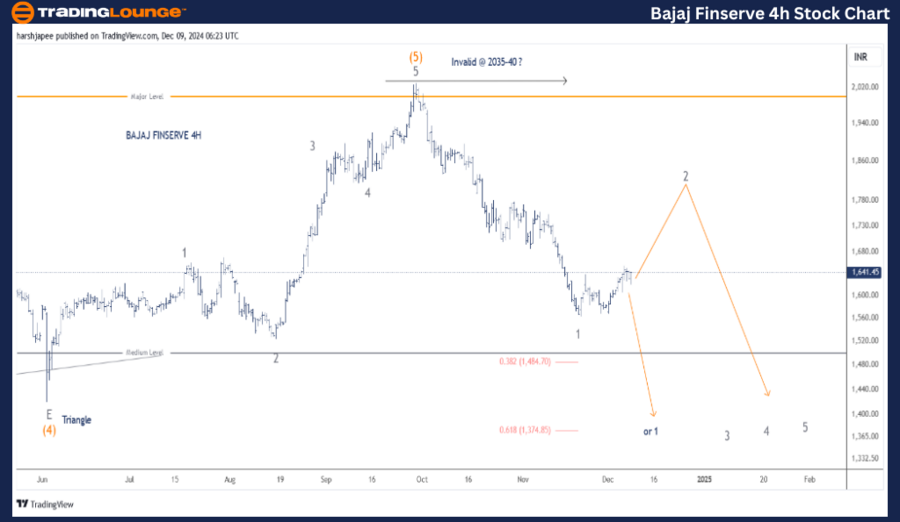
Details: Minor Wave 1 seems to have completed below 1600. If this is accurate, a Minor Wave 2 rally could aim for the 1800 level before bearish control resumes. Alternatively, Minor Wave 1 may complete near the 1400 level, after which the corrective rally would likely commence.

Invalidation point: 2040

BAJAJ FINSERVE 4H Chart Technical Analysis and Potential Elliott Wave Counts

The 4-hour chart of BAJAJ FINSERVE outlines sub-waves following the termination of Intermediate Wave (4) Orange, which concluded as a triangle near the 1420 level in June 2024. Intermediate Wave (5) unfolded as an impulse, peaking around the 2035-2040 range.

Since then, the stock has turned bearish, potentially forming an impulse lower. This impulse may have already completed near 1565 or could extend further to the 1400 zone. Note that the 1400 level aligns closely with the prior triangle termination of Wave (4). Once Minor Wave 1 completes its downward movement, a counter-trend rally is anticipated.

Technical Analyst: Harsh Japee

Source: visit Tradinglounge.com and learn From the Experts Join TradingLounge Here 

Previous: TATAMOTORS Elliott Wave Technical Analysis 

VALUE Offer - Buy 1 Month & Get 3 Months!Click here

Access 7 Analysts Over 200 Markets Covered. Chat Room With Support

BAJAJ-FINSERVE-4h-st...


Conclusion

BAJAJ FINSERVE appears to have reversed below the 2040 high, potentially completing its initial impulse wave drop near 1550. If this analysis holds, a counter-trend rally for Minor Wave 2 Grey is likely to unfold shortly.

Related

Russell 2000 Elliott Wave Analysis Reveals Bullish Momentum and Impulsive Structure on Daily and Weekly Stock Charts

Russell 2000 Elliott Wave Analysis Reveals Bullish Momentum and Impulsive Structure on Daily and Weekly Stock Charts

The Russell 2000 index is showing bullish momentum based on Elliott Wave principles, with impulsive ...

Read More >
ASX Trading Success: CSL LIMITED – CSL Stock Analysis & Elliott Wave Technical | Forecast key price targets

ASX Trading Success: CSL LIMITED – CSL Stock Analysis & Elliott Wave Technical | Forecast key price targets

This comprehensive Elliott Wave analysis of CSL LIMITED on the Australian Stock Exchange (ASX) provi...

Read More >
Berkshire Hathaway (BRK.B) Elliott Wave Analysis: Stock Forecast, ZigZag Correction, Triangle Formation & Technical Outlook

Berkshire Hathaway (BRK.B) Elliott Wave Analysis: Stock Forecast, ZigZag Correction, Triangle Formation & Technical Outlook

Elliott Wave analysis of Berkshire Hathaway Inc. (BRK.B), focusing on a corrective zigzag structure ...

Read More >
JHX Elliott Wave Forecast: James Hardie Industries PLC Stock Analysis & ASX:JHX Price Analysis with Our Latest Technical Outlook

JHX Elliott Wave Forecast: James Hardie Industries PLC Stock Analysis & ASX:JHX Price Analysis with Our Latest Technical Outlook

Our Elliott Wave forecast for JAMES HARDIE INDUSTRIES PLC (JHX) identifies key price movements and t...

Read More >
JSW STEEL Technical Analysis: Elliott Wave Insights, Stock Forecast, Price Prediction, and Market Trends

JSW STEEL Technical Analysis: Elliott Wave Insights, Stock Forecast, Price Prediction, and Market Trends

This analysis delves into JSW STEEL's stock performance using Elliott Wave theory. Highlighting ...

Read More >
Investing in Stocks, ETFs, or index funds: S&P 500 Index Elliott Wave Technical Analysis for Bullish and Bearish Markets

Investing in Stocks, ETFs, or index funds: S&P 500 Index Elliott Wave Technical Analysis for Bullish and Bearish Markets

Explore in-depth S&P 500 Elliott Wave analysis with a focus on trading strategies and investment tip...

Read More >

$1 for 2 Weeks

then $29 a month!

What a Special Offer!

Trade Recommendations

Unleash the power of deversified trading with our comprehensive portfolio, covering 250+ markets:

  • Stock Trades
  • Crypto Trades
  • Forex Trades
  • Commodity Trades
Elliott Wave Analysis

Gain a competitive edge with expert insights and AI-powered Elliott Wave charting into:

  • Global Indices
  • US Stocks & ASX Stocks
  • Forex & Crypto
  • Commodities
Top-Notch Trading Tools

Equip yourself with the tools of success:

  • Real-time Chat rooms
  • Elliott Wave Algorithm
  • Portfolio tools
  • TradingLevels
  • Screener
  • Trading Game
7 Elliott Wave Analysts

Stay ahead of the market with daily charts and insightful videos
Your secret to strategic trading!

JOIN HERE


Welcome to TradingLounge (ASIC A.R.No. 321187), specialists in trades, trading education and technical analysis, covering stocks, indices, commodities, forex and cryptocurrencies.

When you join TradingLounge you have access to everything we offer, including trade tools, educational content and a social platform to chat with like-minded investors.

Read more

@Copyright 2024 by tradinglounge.com

Contact Us

Australian no: 02 4787 6020

International no: +61 (2) 47876020

Pay with:

Find us on