31Jan

JHX Elliott Wave Forecast: James Hardie Industries PLC Stock Analysis & ASX:JHX Price Analysis with Our Latest Technical Outlook

JAMES HARDIE INDUSTRIES PLC (JHX) Elliott Wave Technical Analysis – TradingLounge

Greetings,

Our latest Elliott Wave forecast delivers an updated technical outlook on JAMES HARDIE INDUSTRIES PLC (ASX: JHX), a key stock listed on the Australian Stock Exchange (ASX).

We see bullish momentum building in ASX:JHX, signaling a strong probability of an upward breakout. This analysis will identify critical price levels that validate the beginning of a Wave Three bull market trend.


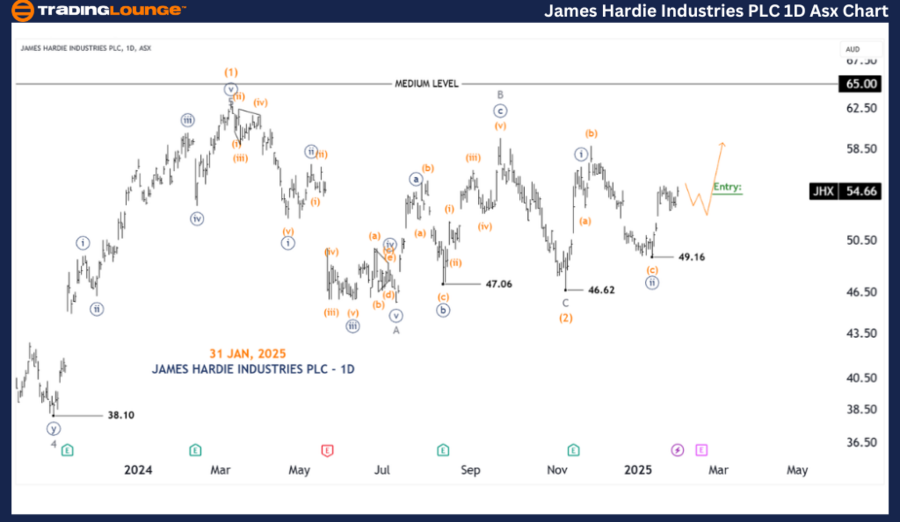
JAMES HARDIE INDUSTRIES PLC (JHX) - 1D Chart Analysis

JHX Elliott Wave Technical Analysis

Function: Major trend (Intermediate degree, Orange)

Mode: Motive

Structure: Impulse

Position: Wave ((iii)) - Navy of Wave (2) - Orange

Details:

Wave ((ii)) - Navy concluded as an Expanded Flat at the 46.16 low.
Wave ((iii)) - Navy is currently advancing upward, confirming the trend continuation.
✔ We anticipate a minor corrective pullback, creating a potential buying opportunity before a stronger rally.
Invalidation Level: 49.16 – A break below this level negates the bullish scenario.

James-hardie-Industr...


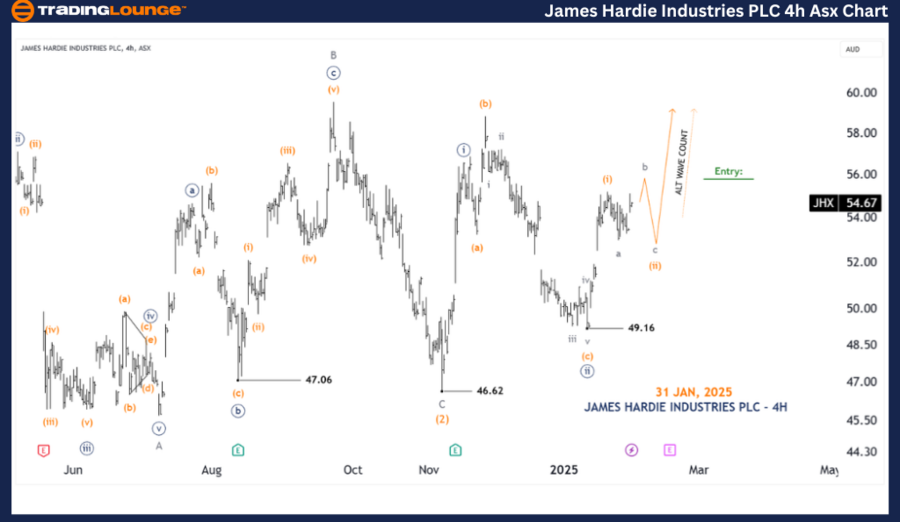
JAMES HARDIE INDUSTRIES PLC (JHX) – 4-Hour Chart Analysis

ASX: JHX Elliott Wave Technical Analysis

Function: Major trend (Minor degree, Grey)

Mode: Motive

Structure: Impulse

Position: Wave (ii) - Orange of Wave ((iii)) - Navy

Details:

Price action from 49.16 suggests Wave (i) - Orange has likely completed.
Wave (ii) - Orange is currently unfolding as an Expanded Flat pattern, expected to complete soon.
Upon completion, Wave (iii) - Orange is projected to resume the upward trend, reinforcing the bull market outlook.
Invalidation Level: 49.16 – A break below this level would require a reassessment of the Elliott Wave structure.
Key Level to Watch: The end of Wave b - Grey, which could determine the next bullish impulse.

Technical Analyst: Hua (Shane) Cuong, CEWA-M (Master’s Designation).

Source: visit Tradinglounge.com and learn From the Experts Join TradingLounge Here 

See Previous: WISETECH GLOBAL LIMITED (WTC) Elliott Wave Technical Analysis

VALUE Offer - Buy 1 Month & Get 3 Months!Click here

Access 7 Analysts Over 200 Markets Covered. Chat Room With Support

James-hardie-Industr...


Conclusion

Our Elliott Wave analysis on JAMES HARDIE INDUSTRIES PLC (JHX) offers an in-depth perspective on current price action and future market direction. By identifying key validation and invalidation levels, we strengthen our bullish Elliott Wave projections.

Through technical precision and structured analysis, our objective is to equip traders and investors with actionable market insights to navigate ASX:JHX trading strategies effectively.

Related

New Zealand Dollar/U.S.Dollar (NZDUSD) 4 Hour Chart Elliott Wave Technical Analysis 13 November 23

New Zealand Dollar/U.S.Dollar (NZDUSD) 4 Hour Chart Elliott Wave Technical Analysis 13 November 23

In conclusion, the NZDUSD Elliott Wave Analysis on the 4-hour chart indicates a trending market with...

Read More >
Elliott Wave Analysis of GDX: Gold Miners ETF Forecast, Wave Count, Price Targets, and Trading Strategy Explained

Elliott Wave Analysis of GDX: Gold Miners ETF Forecast, Wave Count, Price Targets, and Trading Strategy Explained

This technical analysis covers the current Elliott Wave structure of the VanEck Gold Miners ETF (GDX...

Read More >
WTI Crudeoil Commodity Elliott Wave Technical Analysis: Price Prediction and Market Trends Shaping Crude Oil Trading

WTI Crudeoil Commodity Elliott Wave Technical Analysis: Price Prediction and Market Trends Shaping Crude Oil Trading

Stay informed with our WTI crude oil Elliott Wave analysis and technical price forecast. Understand ...

Read More >
Palo Alto Networks (PANW) Elliott Wave Technical  Analysis: Key Stock Predictions & Future Trends

Palo Alto Networks (PANW) Elliott Wave Technical Analysis: Key Stock Predictions & Future Trends

This article provides an in-depth Elliott Wave analysis of Palo Alto Networks (PANW) stock. Covering...

Read More >
USDCAD Elliott Wave Analysis Shows Bearish Impulse Unfolding With Wave 3 in Play – Forecast, Strategy, and Trading Outlook

USDCAD Elliott Wave Analysis Shows Bearish Impulse Unfolding With Wave 3 in Play – Forecast, Strategy, and Trading Outlook

USDCAD is in a bearish Elliott Wave sequence with wave 3 unfolding. The setup suggests further downs...

Read More >
Texas Instruments (TXN) Elliott Wave Analysis: Stock Forecast, Price Prediction, Bullish Trend, and Trading Strategy for Smart Investors

Texas Instruments (TXN) Elliott Wave Analysis: Stock Forecast, Price Prediction, Bullish Trend, and Trading Strategy for Smart Investors

Texas Instruments (TXN) Elliott Wave analysis with insights into its bullish trend, price forecast, ...

Read More >

Buy 1 Month

Get 3 Months!

Special Offer:

Trade Recommendations

Unleash the power of deversified trading with our comprehensive portfolio, covering:

  • Stock Trades
  • Crypto Trades
  • Forex Trades
  • Commodity Trades
Elliott Wave Analysis

Gain a competive edge with expert insights in to:

  • Global Indices
  • US Stocks & ASX Stocks
  • Forex & Crypto
  • Commodities
Top-Notch Trading Tools

Equip yourself with the tools of success:

  • Social Chat
  • Elliott Wave Algorithm
  • Screener
  • TradingLevels
  • Trading Game
7 Elliott Wave Analysts

Stay ahead of the market with daily charts and insightful videos
-Your secret to strategic trading!

JOIN HERE


Welcome to TradingLounge (ASIC A.R.No. 321187), specialists in trades, trading education and technical analysis, covering stocks, indices, commodities, forex and cryptocurrencies.

When you join TradingLounge you have access to everything we offer, including trade tools, educational content and a social platform to chat with like-minded investors.

Read more

@Copyright 2024 by tradinglounge.com

Contact Us

Australian no: 02 4787 6020

International no: +61 (2) 47876020

Pay with:

Find us on