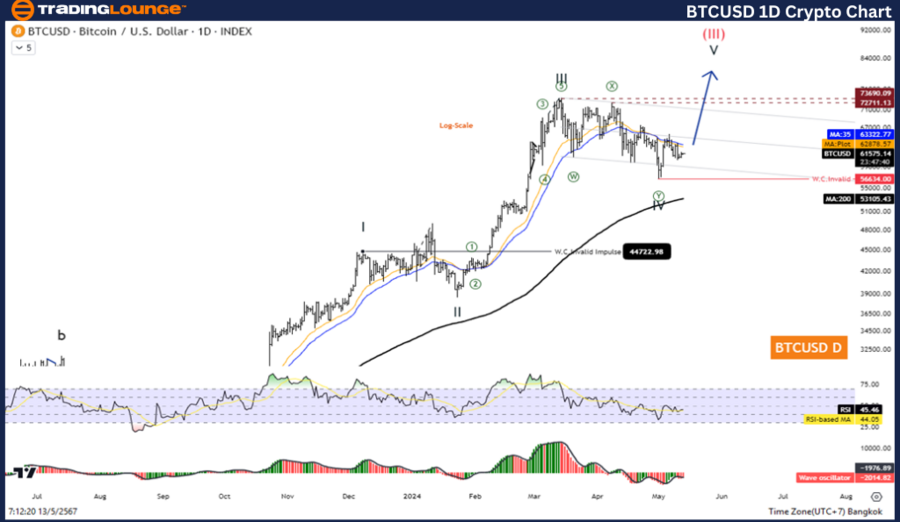
Bitcoin/U.S. Dollar (BTCUSD) Elliott Wave Technical Analysis: Daily Chart Overview
Bitcoin/ U.S. dollar(BTCUSD) Daily Chart Analysis
BTCUSD Elliott Wave Technical Analysis
Function: Counter Trend
Mode: Corrective
Structure: Flat
Position: Wave ((C))
Next Higher Degree: Wave (III)
Wave Cancel Invalid Level: 31,046.25
Detailed Analysis:
The Bitcoin market is showing signs that Wave IV may have concluded, suggesting potential for a price increase moving into Wave V. This phase is typically characterized by a bullish momentum, indicating a pivotal point for traders.
Trading Strategy for BTCUSD on the Daily Chart:
Currently, Bitcoin maintains its broader uptrend, though it is undergoing a correction within the fourth wave. With this correction seemingly complete, now presents a strategic opportunity to re-enter the market. Traders should consider opportunities to initiate long positions, capitalizing on the potential upward movement.
Technical Indicators:
The BTCUSD price positioning above the 200-day Moving Average (MA200) confirms the overall uptrend. Additionally, the Wave Oscillator signals bullish momentum, further supporting the likelihood of upward price action.
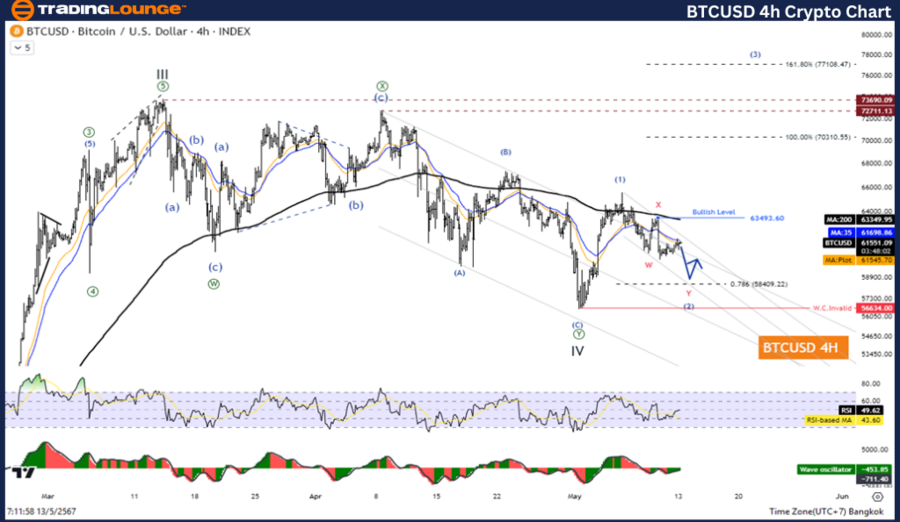
Bitcoin/U.S. Dollar (BTCUSD) Elliott Wave Analysis: H4 Chart Insight
Function: Counter Trend
Mode: Corrective
Structure: Flat
Position: Wave C
Next Higher Degree: Wave (2)
Wave Cancel Invalid Level: 59,835.83
Detailed Analysis:
The analysis of the H4 chart indicates that Wave (2) aligns with 61.8% of Wave (1), situated at 61,903.07. This technical alignment suggests a stabilization phase before the potential continuation of the uptrend.
Trading Strategy for BTCUSD on the H4 Chart:
Bitcoin's performance remains robust as it sustains its uptrend, despite undergoing a temporary correction in its fourth wave. With signs of completion of this corrective phase, traders should look for bullish entry points. Long positions could leverage the expected continuation of the upward trend.
Technical Indicators:
Similar to the daily chart, the BTCUSD remains above the MA200 on the H4 chart, reinforcing the sustained uptrend. The bullish sentiment is echoed by the Wave Oscillator, emphasizing the strength of the current bullish momentum.
Technical Analyst: Kittiampon Somboonsod
Source: visit Tradinglounge.com and learn From the Experts Join TradingLounge Here
See Previous: Elliott Wave Analysis of TRX/USD (Tron/U.S. Dollar)
Special Trial Offer - 0.76 Cents a Day for 3 Months! Click here
Access 7 Analysts Over 170 Markets Covered. Chat Room With Support
Conclusion: Navigating BTCUSD Trends with Elliott Wave Analysis
Elliott Wave Analysis provides a structured approach to understanding market cycles and investor sentiment, as demonstrated in the BTCUSD trading pairs on both daily and H4 charts. With corrective phases nearing completion and technical indicators supporting a continued uptrend, current market conditions favor bullish strategies.
This comprehensive technical analysis offers traders insights into potential future movements, emphasizing the importance of aligning strategies with overarching market trends and momentum indicators. As always, traders should combine these insights with other technical and fundamental analysis tools to optimize their trading decisions and risk management strategies.