Commodity Wheat Elliott Wave Technical Analysis

Function: Trend

Mode: Trend

Structure: Impulse wave

Position: Wave B of (5)

Direction: Wave B of (5) is still in play

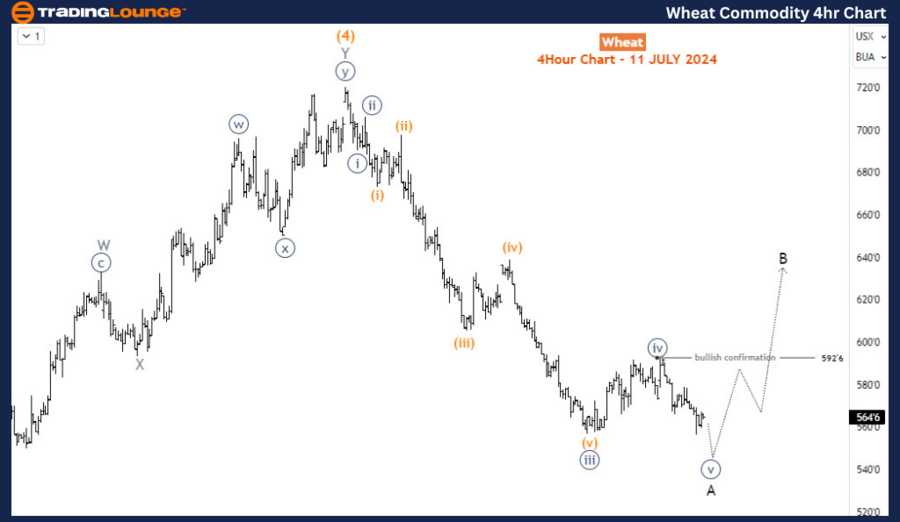
Details: Wave A extends lower. Bullish confirmation for wave B is at 592'6.

Wheat Elliott Wave Technical Analysis

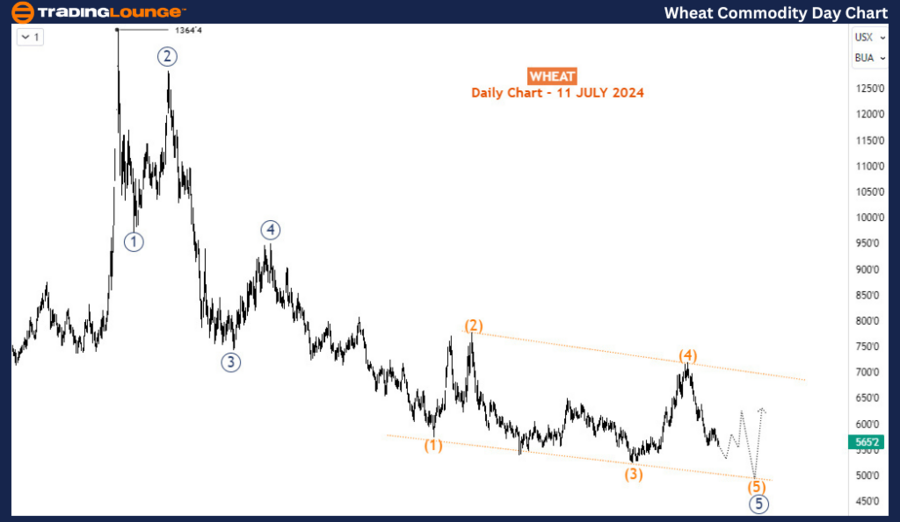
Wheat is extending its decline from late May 2024, nearing a complete unwinding of the significant gains achieved between March and May 2024. This continued weakness adds to the bearish trend that began in March 2022. The commodity is now poised to reach its lowest price since late 2020.

Daily Chart Analysis

The daily chart reveals the ongoing bearish impulse cycle that commenced in March 2022 from the high of 1363. The price is currently completing the fifth wave, wave (5), of this impulse trend. Notably, wave (5) is taking more time to complete compared to the previous waves. Structurally, wave (5) is approaching the completion of an ending diagonal pattern, a specific Elliott Wave formation. The diagonal is in its final leg, suggesting that once it concludes, Wheat is expected to begin its most significant recovery since the peak of 2020.
Wheat-Commodity-Day-...


H4 Chart Analysis

On the H4 chart, wave (5) is finalizing a bearish impulse structure that started from the peak of May 2024. Wave (5) should complete a three-wave structure. This implies that after the current impulse wave decline—wave A of (5)—a corrective bounce for wave B of (5) is anticipated, followed by the final decline for wave C of (5). Currently, wave A is in its last sub-wave, wave v (circled), which could extend to the 520-540 range before finding technical support, upon which the wave B bullish correction could build.

Conclusion

Both the daily and H4 charts indicate a continued bearish trend for Wheat, with the commodity nearing a significant support level. The completion of the ending diagonal pattern on the daily chart suggests an imminent end to the long-term bearish impulse, while the H4 chart outlines the final stages of the current wave A decline. By closely monitoring the completion of wave v (circled) on the H4 chart and the overall ending diagonal on the daily chart, traders can identify strategic entry points to capitalize on the anticipated recovery. The forthcoming corrective bounce in wave B, followed by the final decline in wave C, presents potential opportunities for both short-term bearish positions and long-term bullish positions as Wheat approaches a pivotal support level.

Technical Analyst: Sanmi Adeagbo

Source: visit Tradinglounge.com and learn From the Experts Join TradingLounge Here 

See Previous: WTI Crude Oil Elliott Wave Technical Analysis

Special Trial Offer - 0.76 Cents a Day for 3 Months! Click here

Access 7 Analysts Over 170 Markets Covered. Chat Room With Support
Wheat-Commodity-4hr-...

Related

Technical outlook on: WISETECH GLOBAL LIMITED – WTC Stock Analysis & Elliott Wave Technical Forecast

Technical outlook on: WISETECH GLOBAL LIMITED – WTC Stock Analysis & Elliott Wave Technical Forecast

This article provides an in-depth Elliott Wave analysis for WiseTech Global Limited (WTC) on the Aus...

Read More >
Amazon Inc.(AMZN:NASDAQ) Elliott Wave Technical Analysis 25 October 23

Amazon Inc.(AMZN:NASDAQ) Elliott Wave Technical Analysis 25 October 23

Amazon Inc.(AMZN:NASDAQ) Elliott Wave Technical Analysis For 25 October 23 with 1-Hour and 4-Hour St...

Read More >
Natural Gas Elliott Wave Technical Analysis 12 February 24 Market Trends, Trading Strategies

Natural Gas Elliott Wave Technical Analysis 12 February 24 Market Trends, Trading Strategies

In this comprehensive Natural Gas Elliott Wave Analysis for February 12, traders gain valuable insig...

Read More >
Master Nikkei 225 Index Trading with Expert Elliott Wave Technical  Analysis, Top Stock Picks & Winning Strategies

Master Nikkei 225 Index Trading with Expert Elliott Wave Technical Analysis, Top Stock Picks & Winning Strategies

Stay ahead with the latest Nikkei 225 trading strategies and Elliott Wave analysis. Explore expert N...

Read More >
Wheat Commodity Elliott Wave Technical Analysis: Bullish Corrections and Future Price Movements in Wheat Futures

Wheat Commodity Elliott Wave Technical Analysis: Bullish Corrections and Future Price Movements in Wheat Futures

Our latest wheat price forecast for 2024 is based on Elliott Wave analysis, highlighting key market ...

Read More >
U.S.Dollar /Canadian Dollar(USD/CAD) Elliott Wave Technical Analysis 26 January 24

U.S.Dollar /Canadian Dollar(USD/CAD) Elliott Wave Technical Analysis 26 January 24

USD/CAD Elliott Wave Analysis dated 26 January 24, delves into the technical analysis of the U.S. Do...

Read More >

Buy 1 Month

Get 3 Months!

Special Offer:

Trade Recommendations

Unleash the power of deversified trading with our comprehensive portfolio, covering:

  • Stock Trades
  • Crypto Trades
  • Forex Trades
  • Commodity Trades
Elliott Wave Analysis

Gain a competive edge with expert insights in to:

  • Global Indices
  • US Stocks & ASX Stocks
  • Forex & Crypto
  • Commodities
Top-Notch Trading Tools

Equip yourself with the tools of success:

  • Social Chat
  • Elliott Wave Algorithm
  • Screener
  • TradingLevels
  • Trading Game
7 Elliott Wave Analysts

Stay ahead of the market with daily charts and insightful videos
-Your secret to strategic trading!

JOIN HERE


Welcome to TradingLounge (ASIC A.R.No. 321187), specialists in trades, trading education and technical analysis, covering stocks, indices, commodities, forex and cryptocurrencies.

When you join TradingLounge you have access to everything we offer, including trade tools, educational content and a social platform to chat with like-minded investors.

Read more

@Copyright 2024 by tradinglounge.com

Contact Us

Australian no: 02 4787 6020

International no: +61 (2) 47876020

Pay with:

Find us on