27Jan

British Pound/ U.S. Dollar (GBPUSD) Elliott Wave Analysis: Daily & 4-Hour Chart Forecast for Traders with Key Levels and Trading Strategies

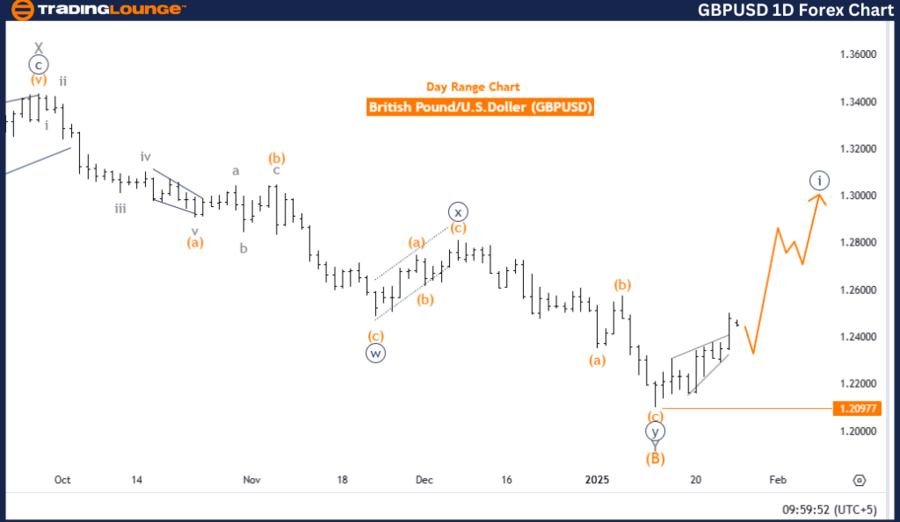
British Pound/ U.S. Dollar (GBPUSD) Elliott Wave Analysis - Trading Lounge Daily Chart Analysis

GBPUSD Elliott Wave Technical Analysis

Function: Bullish Trend

Mode: Impulsive

Structure: Navy Blue Wave 1

Position: Gray Wave 1

Next Lower Degree Direction: Navy Blue Wave 2

Details: Navy Blue Wave 1 within Gray Wave 1 appears to have completed; Navy Blue Wave 2 is currently developing.

Wave Invalidation Level: 1.20977

The GBPUSD daily chart, analyzed using Elliott Wave Theory, indicates a strong bullish trend characterized by an impulsive wave structure. The primary observation revolves around Navy Blue Wave 1, which forms part of the broader Gray Wave 1, marking the beginning of a potential long-term uptrend.

As the market completes Navy Blue Wave 1, it transitions into the corrective phase of Navy Blue Wave 2, which temporarily consolidates previous gains before the upward momentum resumes.

The invalidation level of 1.20977 serves as a critical benchmark; a drop below this level would invalidate the current wave count, prompting a reassessment of the overall market structure.

Summary

The GBPUSD Elliott Wave analysis for the daily chart highlights a bullish outlook, with Navy Blue Wave 1 concluding within Gray Wave 1. The corrective phase of Navy Blue Wave 2 presents trading opportunities for traders looking to capitalize on potential price retracements before the bullish trend resumes. The invalidation level at 1.20977 is essential for risk management, ensuring that traders stay aligned with the correct wave count. By applying Elliott Wave principles, market participants can anticipate the next phase of price movements with greater confidence.

gbpusd-1d-forex-char...


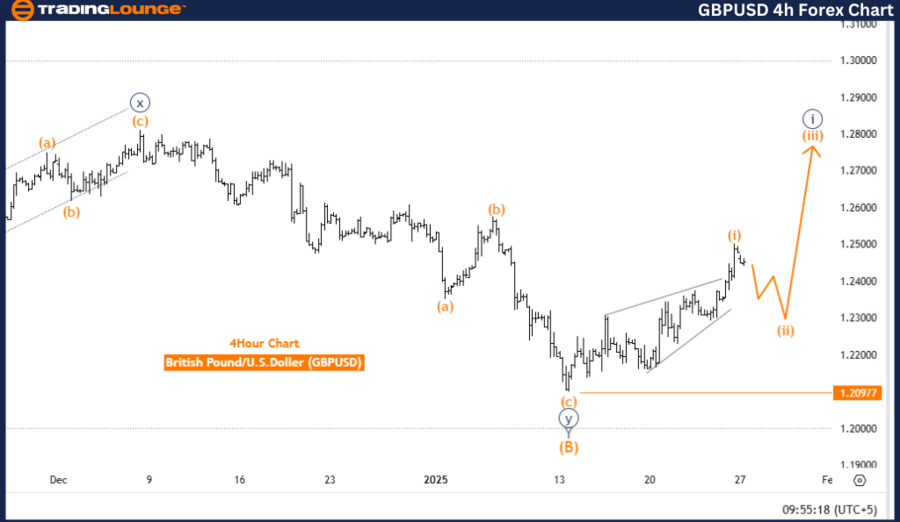
British Pound/ U.S. Dollar (GBPUSD) Elliott Wave Analysis - Trading Lounge 4-Hour Chart Analysis

GBPUSD Elliott Wave Technical Analysis

Function: Counter Trend

Mode: Corrective

Structure: Orange Wave 2

Position: Navy Blue Wave 1

Next Higher Degree Direction: Orange Wave 3

Details: Orange Wave 1 within Navy Blue Wave 1 appears completed; Orange Wave 2 is currently developing.

Wave Invalidation Level: 1.20977

The four-hour GBPUSD Elliott Wave analysis reveals a counter-trend correction, focusing on the development of Orange Wave 2 following the completion of Orange Wave 1 within the larger Navy Blue Wave 1 structure.

With Orange Wave 1 having completed, the market is now experiencing a corrective pullback in the form of Orange Wave 2, which provides a temporary pause within the broader bullish cycle. Once this correction concludes, the market is expected to transition into Orange Wave 3, resuming upward momentum with a higher-degree impulsive move.

The 1.20977 invalidation level acts as a crucial reference point; any price action below this level would require a reassessment of the wave count and trading strategy.

Summary

The GBPUSD four-hour chart analysis showcases an ongoing corrective phase, with Orange Wave 2 following the completion of Orange Wave 1. This retracement offers potential buying opportunities ahead of the anticipated formation of Orange Wave 3, which could drive renewed bullish momentum. Traders should closely monitor the invalidation level to mitigate risk and confirm the wave count's accuracy. By leveraging Elliott Wave analysis, market participants gain valuable insights into the current price action and potential future trends.

Technical Analyst: Malik Awais

Source: visit Tradinglounge.com and learn From the Experts Join TradingLounge Here 

Previous: AUDUSD Elliott Wave Technical Analysis

VALUE Offer - Buy 1 Month & Get 3 Months!Click here

Access 7 Analysts Over 200 Markets Covered. Chat Room With Support

gbpusd-4h-forex-char...

Related

Comprehensive Elliott Wave Analysis of TJX Companies Inc. with Daily and 1-Hour Chart Insights and Stock Projections

Comprehensive Elliott Wave Analysis of TJX Companies Inc. with Daily and 1-Hour Chart Insights and Stock Projections

This Elliott Wave analysis of TJX Companies Inc. (TJX) provides a detailed look at daily and 1-hour ...

Read More >
Caterpillar Inc. (CAT) Elliott Wave Analysis Reveals Daily Wave {iii} Nears Completion and Hourly Wave (v) Eyes $400 Resistance Level

Caterpillar Inc. (CAT) Elliott Wave Analysis Reveals Daily Wave {iii} Nears Completion and Hourly Wave (v) Eyes $400 Resistance Level

Elliott Wave analysis of Caterpillar Inc. (CAT), covering both the daily and 1‑hour charts. Highlig...

Read More >
ASX UNIBAIL-RODAMCO-WESTFIELD (URW) Elliott Wave Analysis: Stock Forecast, Market Insights, Long Trade Setup & Technical Analysis

ASX UNIBAIL-RODAMCO-WESTFIELD (URW) Elliott Wave Analysis: Stock Forecast, Market Insights, Long Trade Setup & Technical Analysis

ASX: URW (UNIBAIL-RODAMCO-WESTFIELD) provides insights into market trends, price movements, and trad...

Read More >
Theta Token (THETAUSD) Elliott Wave Analysis Reveals Bullish Setup With Wave 3 Breakout Potential and Strategic Buy Zone Entry

Theta Token (THETAUSD) Elliott Wave Analysis Reveals Bullish Setup With Wave 3 Breakout Potential and Strategic Buy Zone Entry

Elliott Wave analysis of THETAUSD, highlighting wave structures, technical patterns, and strategic e...

Read More >
NEO/ U.S. dollar(NEOUSD) Elliott Wave Technical Analysis 6 December 23

NEO/ U.S. dollar(NEOUSD) Elliott Wave Technical Analysis 6 December 23

NEO/ U.S. dollar(NEOUSD) Elliott Wave Technical Analysis dated 6 December 23, offers an in-depth per...

Read More >
Elliott Wave Analysis for KOSPI Trading: Stay Updated on the best KOSPI stocks, Daily Reports, and Essential Investment Tips

Elliott Wave Analysis for KOSPI Trading: Stay Updated on the best KOSPI stocks, Daily Reports, and Essential Investment Tips

This article provides a detailed Elliott Wave analysis of the KOSPI Composite Index, offering insigh...

Read More >

$1 for 2 Weeks

then $29 a month!

What a Special Offer!

Trade Recommendations

Unleash the power of deversified trading with our comprehensive portfolio, covering 250+ markets:

  • Stock Trades
  • Crypto Trades
  • Forex Trades
  • Commodity Trades
Elliott Wave Analysis

Gain a competitive edge with expert insights and AI-powered Elliott Wave charting into:

  • Global Indices
  • US Stocks & ASX Stocks
  • Forex & Crypto
  • Commodities
Top-Notch Trading Tools

Equip yourself with the tools of success:

  • Real-time Chat rooms
  • Elliott Wave Algorithm
  • Portfolio tools
  • TradingLevels
  • Screener
  • Trading Game
7 Elliott Wave Analysts

Stay ahead of the market with daily charts and insightful videos
Your secret to strategic trading!

JOIN HERE


Welcome to TradingLounge (ASIC A.R.No. 321187), specialists in trades, trading education and technical analysis, covering stocks, indices, commodities, forex and cryptocurrencies.

When you join TradingLounge you have access to everything we offer, including trade tools, educational content and a social platform to chat with like-minded investors.

Read more

@Copyright 2024 by tradinglounge.com

Contact Us

Australian no: 02 4787 6020

International no: +61 (2) 47876020

Pay with:

Find us on