The latest Elliott Wave analysis for Eaton Corp. PLC (ETN) highlights a promising scenario for traders and investors, with both the daily and 4-hour charts indicating a continuation of the impulsive trend.

Trading Lounge Eaton Corp. PLC (ETN) Daily Chart Analysis

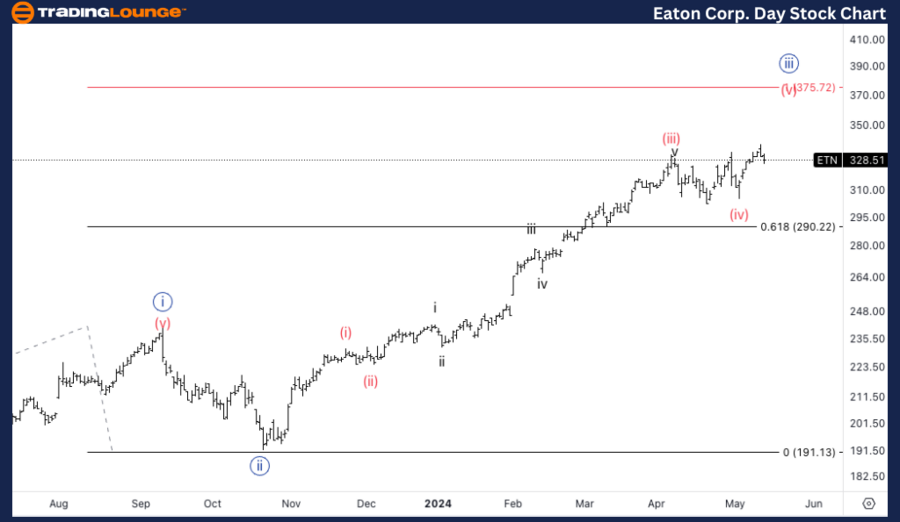
When exploring the technical dynamics of Eaton Corp. PLC (ETN) through the lens of Elliott Wave Theory, we delve into a detailed daily chart analysis. This analytic method categorizes the stock's price movements into various waves, which are essential for predicting future market trends.

Eaton Corp. PLC, (ETN) Stock Analysis

ETN Elliott Wave Technical Analysis

  • Function: Trend Identification
  • Mode: Impulsive Movements
  • Structure: Motive Sequence
  • Position: Minute wave {iii}
  • Direction: Upward Trend in Minuette (v)
  • Key Insights: The current focus is on the upside potential of wave {iii}. The point where wave {iii} equals wave {i} is identified at $375, marking it as a potential ideal target for traders monitoring ETN's price trajectory.

This segment of the Elliott Wave analysis underscores a strong upward trend in Eaton's stock, characterized by impulsive and motive patterns. These patterns suggest a robust continuation of the current bullish phase, particularly in the minute third wave, which offers significant potential for investors.

Eaton-Corp-Day-Stock...


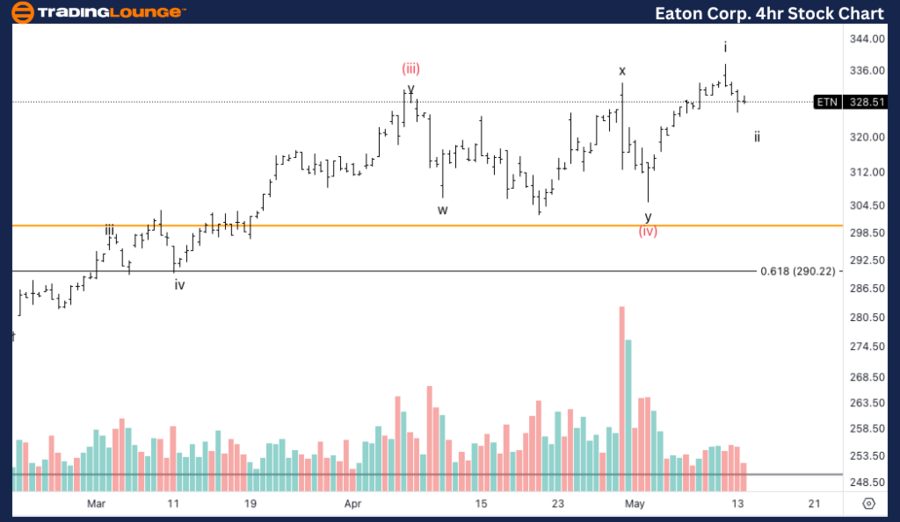
Trading Lounge Eaton Corp. PLC (ETN) 4-Hour Chart Analysis

Switching to a more granular 4-hour chart, Eaton Corp. PLC's stock demonstrates a similar adherence to Elliott Wave principles but focuses on shorter-term price movements.

  • Function: Trend Identification
  • Mode: Impulsive Movements
  • Structure: Motive Sequence
  • Position: Wave ii of (v)
  • Direction: Anticipated Upward Movement in wave iii
  • Key Insights: The analysis predicts a pullback in wave ii, which is expected to set the stage for a subsequent upward surge in wave iii. The volume analysis supports the corrective nature of wave ii, indicating a typical three-wave structure in this pullback.

For traders and investors, this detailed 4-hour chart analysis offers a tactical view of Eaton's stock, emphasizing the potential for short-term trading opportunities. The expected pullback in wave ii provides a strategic entry point, after which the market is anticipated to resume its upward trajectory in wave iii.

Technical Analyst: Malik Awais

Source: visit Tradinglounge.com and learn From the Experts Join TradingLounge Here 

See Previous: Alibaba Group Holdings Ltd. (BABA) Stock

Special Trial Offer - 0.76 Cents a Day for 3 Months! Click here

Access 7 Analysts Over 170 Markets Covered. Chat Room With Support

Eaton-Corp-4Hr-Stock...

Related

NIFTY 50(INDIA) Index Elliott Wave Technical Analysis Provides Detailed Insights into current market trends

NIFTY 50(INDIA) Index Elliott Wave Technical Analysis Provides Detailed Insights into current market trends

The NIFTY 50 (India) Elliott Wave Analysis provides detailed insights into current market trends usi...

Read More >
Silver XAGUSD Commodity Elliott Wave Technical Analysis: Support Levels and Future Price Movements

Silver XAGUSD Commodity Elliott Wave Technical Analysis: Support Levels and Future Price Movements

This comprehensive analysis of Silver includes detailed Elliott Wave Analysis, price predictions, an...

Read More >
Apple Inc. (AAPL) Stocks Elliott Wave Technical Analysis: Forecast and Insights

Apple Inc. (AAPL) Stocks Elliott Wave Technical Analysis: Forecast and Insights

Explore our detailed analysis of Apple Inc. (AAPL) using Elliott Wave Theory. Understand the current...

Read More >
Mahindra & Mahindra Stock Analysis: Elliott Wave Forecast Reveals Bullish Trend, Critical Support Levels, and Upcoming Price Movements

Mahindra & Mahindra Stock Analysis: Elliott Wave Forecast Reveals Bullish Trend, Critical Support Levels, and Upcoming Price Movements

Mahindra & Mahindra stock analysis uses Elliott Wave patterns to forecast bullish trends, key suppor...

Read More >
Unlocking ASX Trading Success: WISETECH GLOBAL LIMITED - WTC Stock Analysis & Elliott Wave Technical Forecast

Unlocking ASX Trading Success: WISETECH GLOBAL LIMITED - WTC Stock Analysis & Elliott Wave Technical Forecast

Elliott Wave analysis of WiseTech Global Limited (WTC) on the ASX offers a detailed breakdown of th...

Read More >
Learn the key aspects of NAB Stock Analysis & Elliott Wave Technical Forecast: NATIONAL AUSTRALIA BANK LIMITED

Learn the key aspects of NAB Stock Analysis & Elliott Wave Technical Forecast: NATIONAL AUSTRALIA BANK LIMITED

Stay ahead with our comprehensive analysis of National Australia Bank (NAB) stocks using Elliott Wav...

Read More >

$1 for 2 Weeks

then $29 a month!

What a Special Offer!

Trade Recommendations

Unleash the power of deversified trading with our comprehensive portfolio, covering 250+ markets:

  • Stock Trades
  • Crypto Trades
  • Forex Trades
  • Commodity Trades
Elliott Wave Analysis

Gain a competitive edge with expert insights and AI-powered Elliott Wave charting into:

  • Global Indices
  • US Stocks & ASX Stocks
  • Forex & Crypto
  • Commodities
Top-Notch Trading Tools

Equip yourself with the tools of success:

  • Real-time Chat rooms
  • Elliott Wave Algorithm
  • Portfolio tools
  • TradingLevels
  • Screener
  • Trading Game
7 Elliott Wave Analysts

Stay ahead of the market with daily charts and insightful videos
Your secret to strategic trading!

JOIN HERE


Welcome to TradingLounge (ASIC A.R.No. 321187), specialists in trades, trading education and technical analysis, covering stocks, indices, commodities, forex and cryptocurrencies.

When you join TradingLounge you have access to everything we offer, including trade tools, educational content and a social platform to chat with like-minded investors.

Read more

@Copyright 2024 by tradinglounge.com

Contact Us

Australian no: 02 4787 6020

International no: +61 (2) 47876020

Pay with:

Find us on