ASX: Brambles Limited – BXB Elliott Wave Analysis (1D Chart)
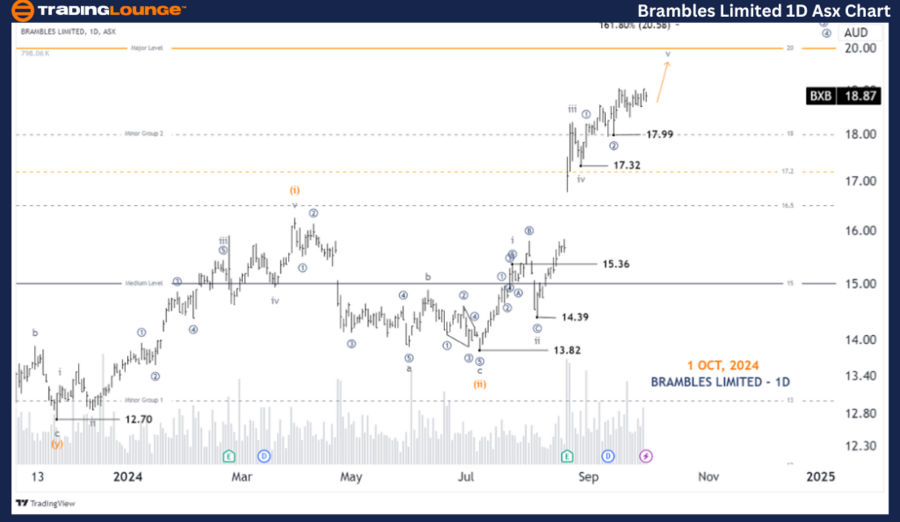
Greetings! In today's Elliott Wave analysis, we update the Australian Stock Exchange (ASX) on BRAMBLES LIMITED - BXB. The chart suggests that BXB may continue its upward movement, driven by the v-grey wave.
ASX: BRAMBLES LIMITED - BXB 1D Chart (Semilog Scale) Analysis
BXB Elliott Wave Technical Analysis
Function: Major trend (Minuette degree, orange)
Mode: Motive
Structure: Impulse
Position: Wave ((3))-navy of Wave v-grey of Wave (iii)-orange
Details: The v-grey wave is pushing higher and may reach the Major Level of 20.00. The wave is expanding and subdividing into wave ((3))-navy within the v-grey wave, signaling further upward potential.
Invalidation point: 17.99

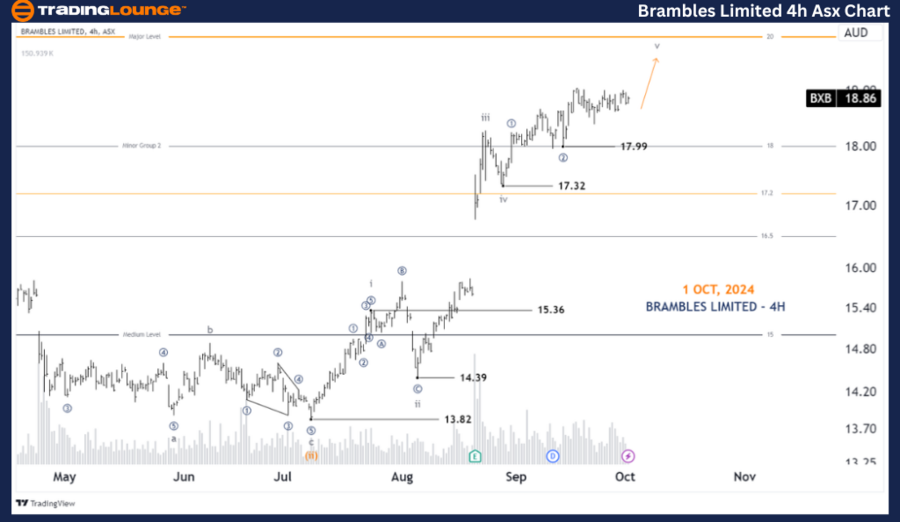
ASX: Brambles Limited - BXB 4-Hour Chart Analysis
Function: Major trend (Minute degree, navy)
Mode: Motive
Structure: Impulse
Position: Wave ((3))-navy of Wave v-grey
Details: Since the low at 17.32, the v-grey wave has unfolded to the upside. Wave ((1))-navy and wave ((2))-navy have completed, and wave ((3))-navy is pushing higher, with the potential to reach the Major Level of 20.00.
Invalidation point: 17.99
Technical Analyst: Hua (Shane) Cuong, CEWA-M (Master’s Designation).
Source: visit Tradinglounge.com and learn From the Experts Join TradingLounge Here
See Previous: Wisetech Global Limited - WTC Elliott Wave Technical Analysis
VALUE Offer - Buy 1 Month & Get 3 Months!Click here
Access 7 Analysts Over 200 Markets Covered. Chat Room With Support

Conclusion
This ASX: BRAMBLES LIMITED - BXB analysis provides insights into the current Elliott Wave patterns and market trends. Key price levels, including potential validation and invalidation points, support our wave count and enhance our confidence in this forecast. We aim to offer an objective, professional perspective to help traders navigate these market conditions effectively.