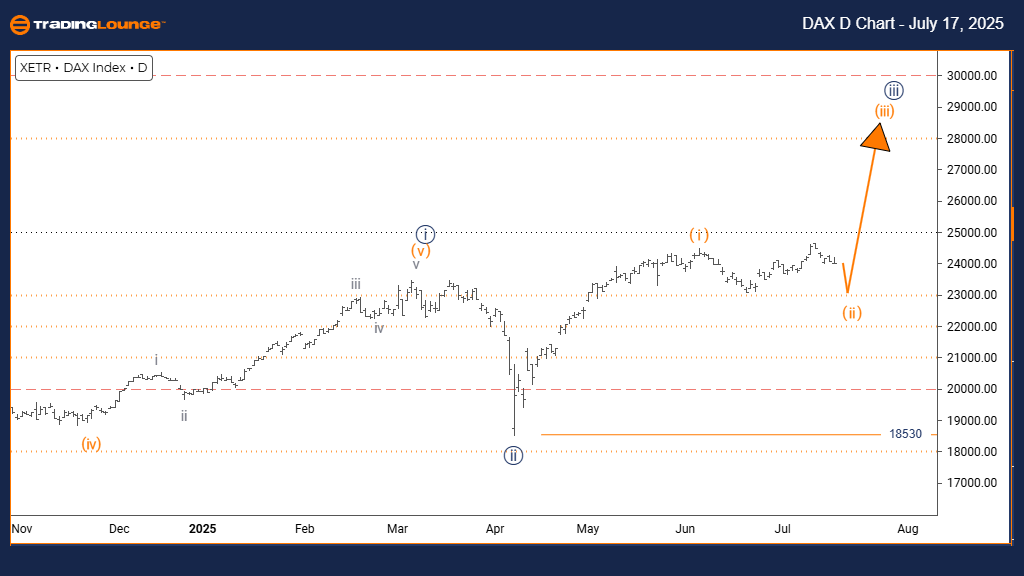
DAX (Germany) Elliott Wave Analysis – Trading Lounge Day Chart
DAX (Germany) Index Day Chart Technical Review
DAX (Germany) Elliott Wave Technical Analysis
FUNCTION: Counter Trend
MODE: Corrective
STRUCTURE: Orange Wave 2
POSITION: Navy Blue Wave 1
DIRECTION NEXT HIGHER DEGREES: Orange Wave 3
DETAILS: Completion of Orange Wave 1 confirmed. Orange Wave 2 currently unfolding.
Invalidation Level: 18530
The daily Elliott Wave forecast for the DAX Index indicates a short-term counter-trend correction. Orange Wave 2 is developing after the conclusion of Orange Wave 1. This pattern fits within the overarching Navy Blue Wave 1, suggesting a brief pullback amid a broader bullish framework.
Price action aligns with classic corrective wave behaviour—slower momentum and potential sideways consolidation. Orange Wave 2 signals a probable pause before the initiation of Orange Wave 3. The 18530 invalidation level is a critical marker; a move below this threshold nullifies the current wave analysis.
This technical setup suggests the DAX could be forming a temporary bottom, potentially offering trading opportunities aligned with the next bullish wave. Traders should closely observe for signs of Orange Wave 2 completion to position for Orange Wave 3. The correction is likely contained, reinforcing its role as a retracement and not a reversal.
From a daily trading perspective, this wave count emphasizes a brief corrective window within an ongoing uptrend. Price action near the 18530 level will confirm or challenge the wave scenario. This Elliott Wave model supports a methodical trading approach for forecasting upcoming trend movements.
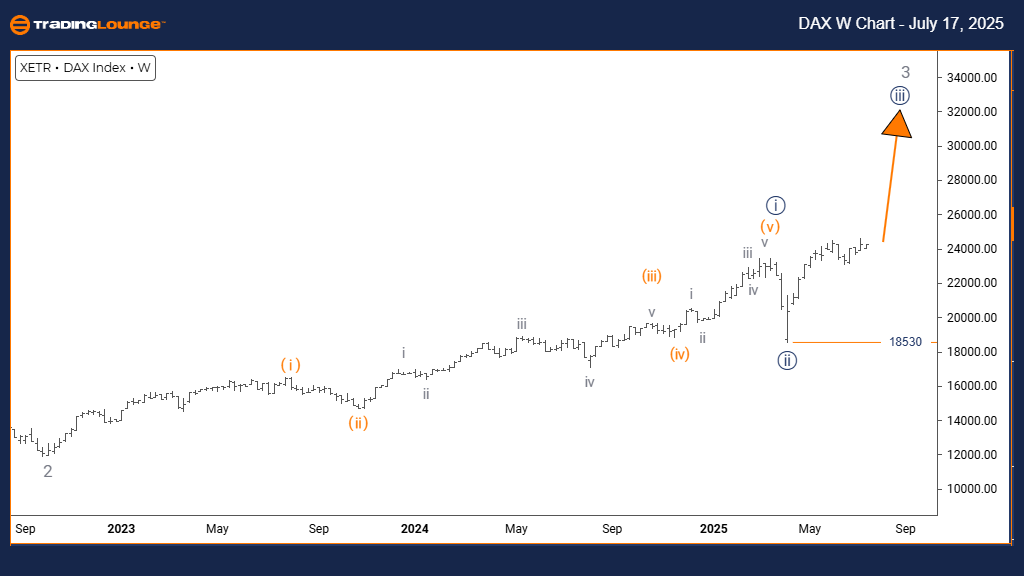
DAX (Germany) Elliott Wave Analysis – Trading Lounge Weekly Chart
DAX (Germany) Wave Technical Review
FUNCTION: Bullish Trend
MODE: Impulsive
STRUCTURE: Navy Blue Wave 3
POSITION: Gray Wave 3
DIRECTION NEXT LOWER DEGREES: Navy Blue Wave 4
DETAILS: Navy Blue Wave 2 completed. Navy Blue Wave 3 of 3 currently progressing.
Invalidation Level: 18530
The weekly Elliott Wave analysis of the DAX Index confirms a robust bullish trend underpinned by impulsive momentum. The current development of Navy Blue Wave 3, nested within Gray Wave 3, suggests strong upside potential typical of Wave 3 phases.
The end of Navy Blue Wave 2 initiates a powerful Navy Blue Wave 3, historically the most aggressive move in an Elliott Wave structure. This segment typically draws in institutional buyers and signals strong investor confidence. The 18530 level remains the technical invalidation threshold.
This wave structure indicates sustained bullish momentum, with room for further gains before facing key resistance zones. The market structure supports a continuation of the uptrend, enhancing the reliability of the bullish projection.
Traders can align with this momentum phase by targeting minor dips for long setups while managing downside risks via the 18530 level. Volume and price action during Navy Blue Wave 3 are expected to confirm persistent demand, affirming the strength of the ongoing trend.
Technical Analyst: Malik Awais
Source: Visit Tradinglounge.com and learn from the Experts. Join TradingLounge Here
Previous: S&P BSE SENSEX NEXT 50 Elliott Wave Technical Analysis
VALUE Offer - $1 for 2 Weeks then $29 a month!Click here
Access 7 Analysts Over 200 Markets Covered. Chat Room With Support