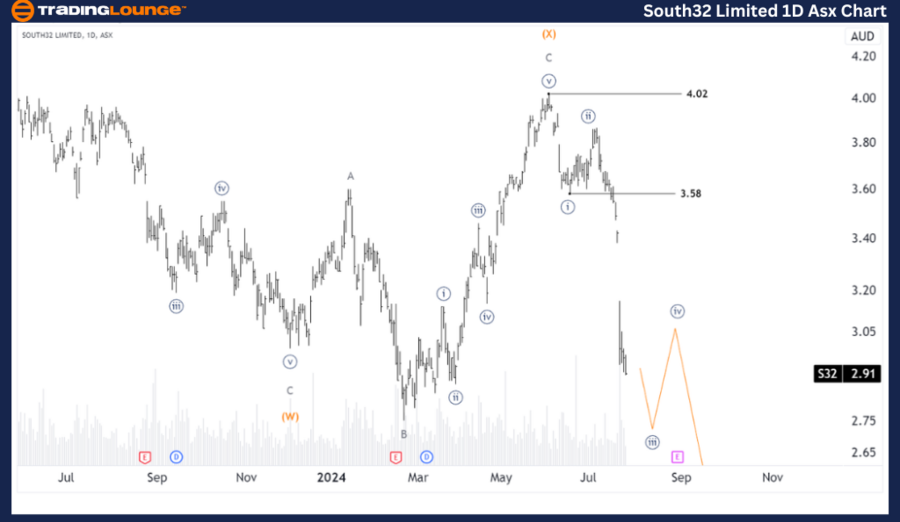
ASX: SOUTH32 LIMITED – S32 Elliott Wave Technical Analysis (1D Chart)

Greetings, our latest Elliott Wave analysis focuses on the Australian Stock Exchange (ASX) listed company, SOUTH32 LIMITED (S32). The current outlook shows a prolonged downtrend, differing from our previous forecasts, but consistent with recent market movements. Our prior analysis helped traders exit unfavorable long positions, and we now anticipate S32 to continue its downward trajectory.

ASX: SOUTH32 LIMITED – S32 Elliott Wave Technical Analysis

ASX: SOUTH32 LIMITED – S32 1D Chart (Semilog Scale) Analysis

Function: Major Trend (Minor degree, gray)

Mode: Motive

Structure: Impulse

Position: Wave ((iii)) - navy of Wave A - grey

Details: Wave ((iii)) - navy is developing and expected to push further downward before completing. After this, Wave ((iv)) - navy is projected to move slightly higher, followed by Wave ((v)) - navy, which will continue the downward movement.

Invalidation Point: 3.58

South32-Limited-1D-A...


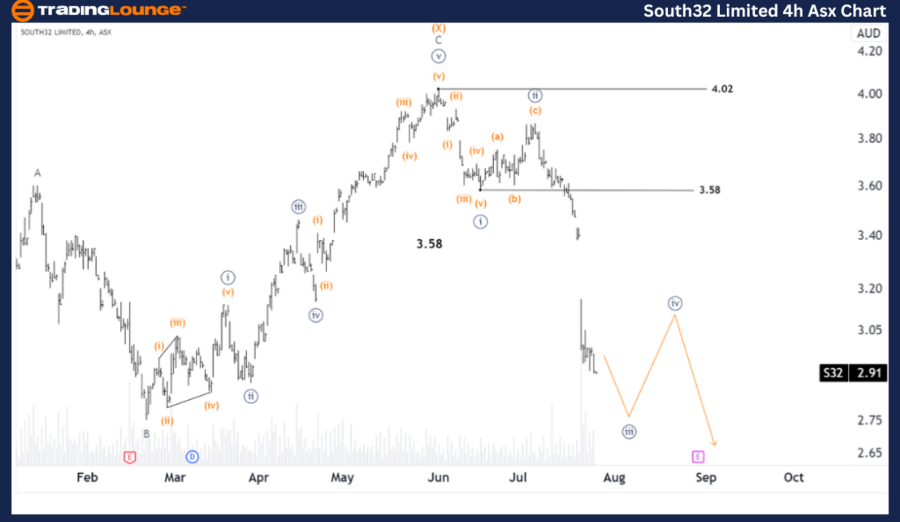
ASX: SOUTH32 LIMITED – S32 Elliott Wave Technical Analysis (4-Hour Chart)

ASX: SOUTH32 LIMITED – S32 Elliott Wave Technical Analysis

ASX: SOUTH32 LIMITED – S32 4-Hour Chart Analysis

Function: Major Trend (Minute degree, navy)

Mode: Motive

Structure: Impulse

Position: Wave ((iii)) - navy

Details: The current decline in Wave ((iii)) - navy suggests limited potential for further downward movement, indicating an imminent end. Subsequently, Wave ((iv)) - navy is expected to trend slightly higher before Wave ((v)) - navy resumes the downward trajectory.

Invalidation Point: 3.87

Conclusion:

Our analysis provides a detailed forecast of the contextual trends and short-term outlook for ASX: SOUTH32 LIMITED (S32), offering valuable insights for traders navigating the current market conditions. By identifying specific price points that validate or invalidate our wave counts, we aim to enhance confidence in our projections. This analysis offers a professional and objective perspective on market trends.

Technical Analyst: Hua (Shane) Cuong, CEWA-M (Master’s Designation).

Source: visit Tradinglounge.com and learn From the Experts Join TradingLounge Here 

Previous: ASX: SCENTRE GROUP (SCG) Elliott Wave Technical Analysis

Special Trial Offer - 0.76 Cents a Day for 3 Months! Click here

Access 7 Analysts Over 170 Markets Covered. Chat Room With Support

South32-Limited-4hr-...

Related

S&P/TSX 60 Elliott Wave Chart Reveals Bullish Impulse With Strong Wave 3 Setup and Key Support Holding at 1339

S&P/TSX 60 Elliott Wave Chart Reveals Bullish Impulse With Strong Wave 3 Setup and Key Support Holding at 1339

The S&P/TSX 60 Elliott Wave count shows a bullish structure with wave 3 developing. Canadian stocks ...

Read More >
Explore GOOGL Elliott Wave Analysis, Alphabet Inc Stock forecast and Market movements using Expert Technical Analysis

Explore GOOGL Elliott Wave Analysis, Alphabet Inc Stock forecast and Market movements using Expert Technical Analysis

Explore GOOGL stock Elliott Wave patterns and Alphabet Inc stock forecast using expert technical ana...

Read More >
Australian Dollar/U.S. Dollar (AUDUSD) Elliott Wave Analysis: Ideal for both Novice and Experienced Forex Traders

Australian Dollar/U.S. Dollar (AUDUSD) Elliott Wave Analysis: Ideal for both Novice and Experienced Forex Traders

Gain expert insights into the AUDUSD currency pair with a comprehensive Elliott Wave analysis. This ...

Read More >
S&P/ASX 200 Index Elliott Wave Technical Analysis: XJO Trends, Forecasts, and Investment Strategies

S&P/ASX 200 Index Elliott Wave Technical Analysis: XJO Trends, Forecasts, and Investment Strategies

Discover expert insights on S&P/ASX 200 trading and investing with in-depth Elliott Wave analysis, X...

Read More >
Nifty 50 Elliott Wave Bullish Impulse Wave 3 on Daily & Weekly – Watch Invalidation Level 24384, Await Wave 2 Pullback

Nifty 50 Elliott Wave Bullish Impulse Wave 3 on Daily & Weekly – Watch Invalidation Level 24384, Await Wave 2 Pullback

Elliott Wave analysis on Nifty 50 shows bullish impulsive Wave 3 in progress on daily and weekly cha...

Read More >
XRPUSD Elliott Wave Analysis Shows Key Fibonacci Support with Bullish Breakout Potential for Crypto Traders and Swing Trading Strategy

XRPUSD Elliott Wave Analysis Shows Key Fibonacci Support with Bullish Breakout Potential for Crypto Traders and Swing Trading Strategy

This article offers an in-depth XRPUSD Elliott Wave analysis featuring key support/resistance levels...

Read More >

$1 for 2 Weeks

then $29 a month!

What a Special Offer!

Trade Recommendations

Unleash the power of deversified trading with our comprehensive portfolio, covering 250+ markets:

  • Stock Trades
  • Crypto Trades
  • Forex Trades
  • Commodity Trades
Elliott Wave Analysis

Gain a competitive edge with expert insights and AI-powered Elliott Wave charting into:

  • Global Indices
  • US Stocks & ASX Stocks
  • Forex & Crypto
  • Commodities
Top-Notch Trading Tools

Equip yourself with the tools of success:

  • Real-time Chat rooms
  • Elliott Wave Algorithm
  • Portfolio tools
  • TradingLevels
  • Screener
  • Trading Game
7 Elliott Wave Analysts

Stay ahead of the market with daily charts and insightful videos
Your secret to strategic trading!

JOIN HERE


Welcome to TradingLounge (ASIC A.R.No. 321187), specialists in trades, trading education and technical analysis, covering stocks, indices, commodities, forex and cryptocurrencies.

When you join TradingLounge you have access to everything we offer, including trade tools, educational content and a social platform to chat with like-minded investors.

Read more

@Copyright 2024 by tradinglounge.com

Contact Us

Australian no: 02 4787 6020

International no: +61 (2) 47876020

Pay with:

Find us on