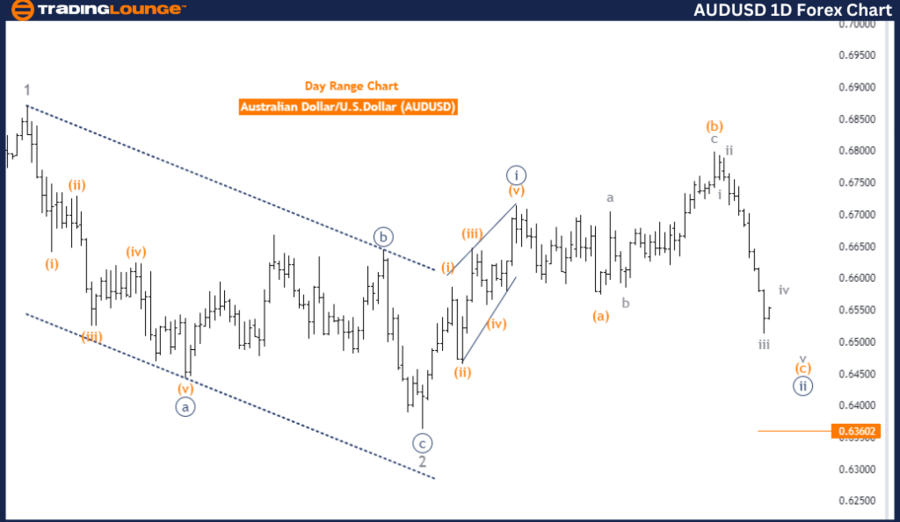
Australian Dollar/U.S. Dollar (AUDUSD) Daily Chart Analysis
Analysis Type: Elliott Wave Technical Analysis
Function: Counter Trend
Mode: Impulsive as C
Structure: Orange Wave C
Position: Navy Blue Wave 2
Next Higher Degree Direction: Navy Blue Wave 3
AUDUSD Elliott Wave Technical Analysis
The AUDUSD Elliott Wave Analysis on the daily chart highlights a counter-trend phase, marked by an impulsive wave C. The analysis indicates that orange wave C is currently forming within navy blue wave 2. This suggests the market is in a final corrective phase before potentially continuing the primary trend.
The forecast predicts the emergence of navy blue wave 3 as the next significant movement, suggesting that after the completion of wave C within wave 2, the market may progress into wave 3 of a larger degree, usually associated with a strong trend.
Notably, the analysis identifies that orange wave b has concluded, with the market now in the impulsive phase of orange wave C within wave 2. This phase marks a reversal from the corrective wave b, moving in the opposite direction.
The critical wave cancel invalid level is set at 0.63602. If the market price drops below this level, the current wave analysis will be invalidated, requiring a reassessment.
Summary: The AUDUSD daily chart analysis reveals a counter-trend phase in orange wave C, situated in navy blue wave 2. With the completion of wave B, the market is now in the impulsive phase of wave C. Following this phase, the market is expected to transition into navy blue wave 3, resuming the primary trend. The wave cancel invalid level at 0.63602 is crucial for validating the current wave analysis.
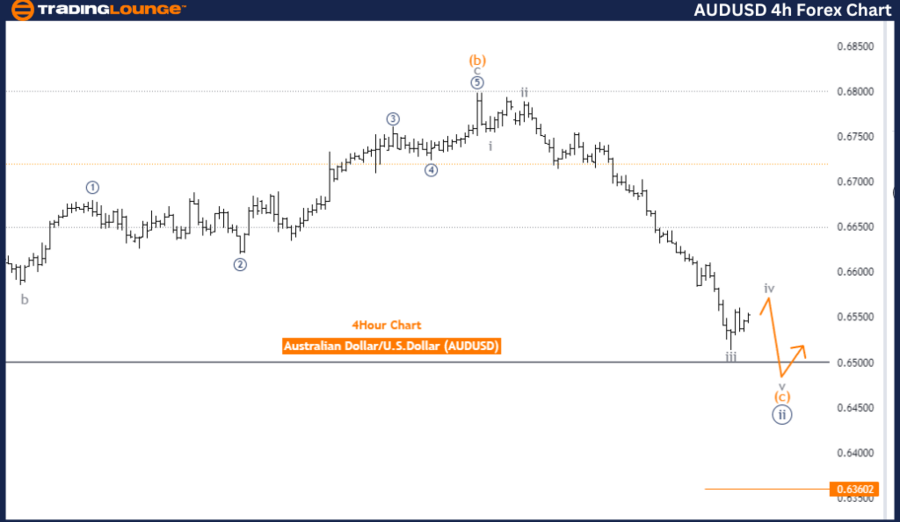
Australian Dollar/U.S. Dollar (AUDUSD) 4-Hour Chart Analysis
Analysis Type: Elliott Wave Technical Analysis
Function: Counter Trend
Mode: Corrective
Structure: Gray Wave 4
Position: Orange Wave C
Next Lower Degree Direction: Gray Wave 5
The AUDUSD Elliott Wave Analysis on the 4-hour chart indicates a counter-trend phase, classified as corrective. This phase suggests a temporary pause or reversal within a larger trend. The current wave structure is identified as gray wave 4, positioned within orange wave C, indicating a corrective or consolidative movement typical of a fourth wave in a larger sequence.
The analysis forecasts that the next lower degree direction will be gray wave 5, suggesting that after the completion of the current corrective phase (gray wave 4), the market may transition into gray wave 5, likely resuming the main trend.
A key aspect of this analysis is the completion of gray wave 3, with the market currently in gray wave 4 of C. This positioning indicates a period of consolidation or sideways movement, without a strong directional trend.
The wave cancel invalid level is set at 0.63602, serving as a crucial threshold for the current wave structure. If the market price falls below this level, it would invalidate the current wave analysis, necessitating a revision.
Summary: The AUDUSD 4-hour chart analysis indicates a corrective counter-trend phase in gray wave 4, positioned within orange wave C. The market is currently consolidating, and upon completion of this phase, it is expected to transition into gray wave 5, resuming the primary trend direction. The wave cancel invalid level at 0.63602 is a critical validation point for the current wave analysis.
Technical Analyst: Malik Awais
Source: visit Tradinglounge.com and learn From the Experts Join TradingLounge Here
Previous: EURGBP Elliott Wave Technical Analysis
Special Trial Offer - 0.76 Cents a Day for 3 Months! Click here
Access 7 Analysts Over 170 Markets Covered. Chat Room With Support