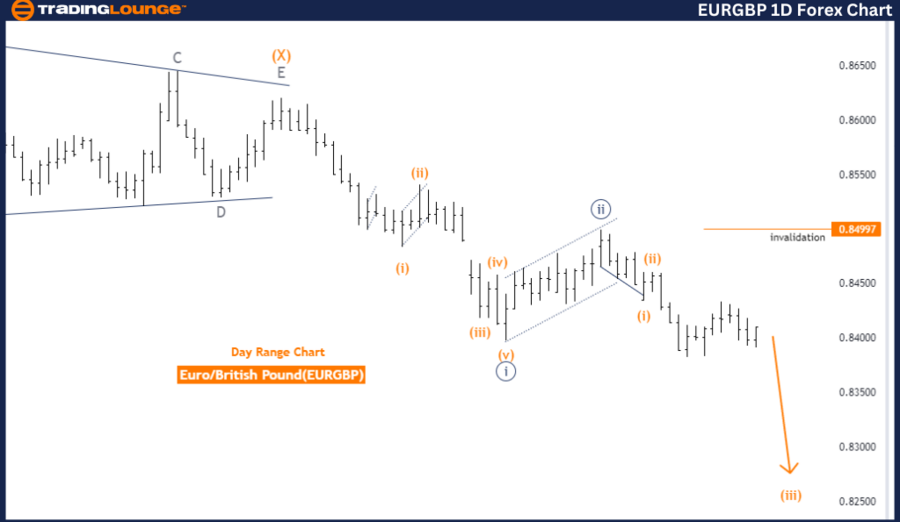
EURGBP Elliott Wave Analysis Trading Lounge Day Chart
Euro/British Pound (EURGBP) Day Chart Analysis
EURGBP Elliott Wave Technical Analysis
- Function: Trend
- Mode: Impulsive
- Structure: Orange wave 3
- Position: Navy Blue Wave 3
- Direction Next Higher Degrees: Orange wave 4
- Details: Orange wave 2 appears complete; now orange wave 3 of 3 is active.
- Wave Cancel Invalid Level: 0.84997
The EURGBP Elliott Wave Analysis on the day chart indicates a current trending phase, characterized by an impulsive mode. This mode signals strong, directional price movements. The wave structure under review is orange wave 3, which is positioned within navy blue wave 3. This positioning suggests the market is in the third wave of a larger impulsive sequence, typically associated with significant price movements.
The analysis indicates that the next higher degree direction will be orange wave 4. This implies that after the completion of the current impulsive wave (orange wave 3), the market is expected to enter a corrective phase (orange wave 4). This phase generally involves a pullback or consolidation period before resuming the primary trend.
Detailed observations reveal that orange wave 2 has completed, indicating the market has transitioned from a corrective phase into orange wave 3 of 3. This wave is essential as it often signifies a strong continuation of the trend, usually marked by substantial price increases.
A crucial part of this analysis is the wave cancellation invalid level, set at 0.84997. This level is critical for validating the current wave structure. If the market price drops below this level, the current wave analysis would be invalidated, necessitating a re-assessment of the wave pattern.
In summary, the EURGBP day chart analysis shows the market is in an impulsive trend phase within orange wave 3, following the completion of orange wave 2. The focus remains on orange wave 3 of 3, suggesting strong upward momentum. The transition to orange wave 4, a corrective phase, is anticipated once the current impulsive wave concludes. The wave cancel invalid level at 0.84997 is essential for maintaining the validity of the analysis.
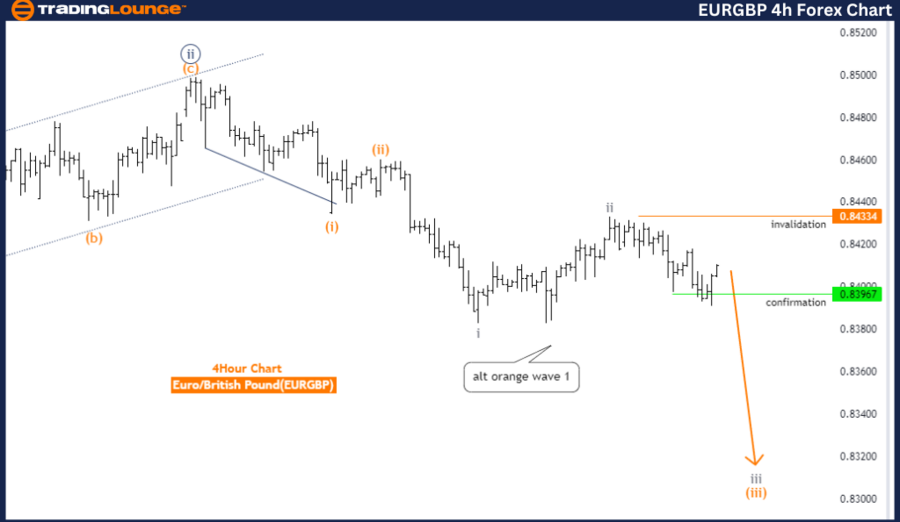
EURGBP Elliott Wave Analysis Trading Lounge 4-Hour Chart
Euro/British Pound (EURGBP) 4 Hour Chart Analysis
EURGBP Elliott Wave Technical Analysis
- Function: Trend
- Mode: Impulsive
- Structure: Gray wave 3
- Position: Orange wave 3
- Direction Next Higher Degrees: Gray wave 4
- Details: Gray wave 2 appears complete; now gray wave 3 of 3 is active.
- Wave Cancel Invalid Level: 0.84334
The EURGBP Elliott Wave Analysis on the 4-hour chart also indicates a trending phase, marked by an impulsive mode. This mode signifies strong, directional price movements. The current wave structure under analysis is gray wave 3, with a particular focus on orange wave 3 within this structure. This placement suggests the market is in the third wave of a larger impulsive sequence, usually characterized by the most significant price movements.
The next higher degree direction is indicated as gray wave 4. This suggests that after the current impulsive wave (gray wave 3) completes, the market is expected to enter a corrective phase (gray wave 4). This phase typically involves a pullback or consolidation before the market continues in its primary trend direction.
Detailed analysis shows that gray wave 2 is complete, indicating the market has ended a corrective phase and has now entered gray wave 3 of 3, part of the impulsive sequence. This wave is crucial as it generally signifies a strong continuation of the trend, often marked by substantial price movements.
A critical aspect of this analysis is the wave cancellation invalid level, set at 0.84334. This level is vital for validating the current wave structure. If the market price falls below this point, the current wave analysis would be invalidated, necessitating a re-evaluation of the wave pattern.
In summary, the EURGBP 4-hour chart analysis suggests the market is in an impulsive trend phase, specifically within gray wave 3, following the completion of gray wave 2. The current focus is on orange wave 3 within this structure, indicating strong upward momentum. The analysis anticipates a transition to gray wave 4, a corrective phase, once the current impulsive wave completes. The wave cancel invalid level at 0.84334 is crucial for maintaining the validity of this wave analysis.
Technical Analyst: Malik Awais
Source: visit Tradinglounge.com and learn From the Experts Join TradingLounge Here
Previous: USDCHF Elliott Wave Technical Analysis
Special Trial Offer - 0.76 Cents a Day for 3 Months! Click here
Access 7 Analysts Over 170 Markets Covered. Chat Room With Support