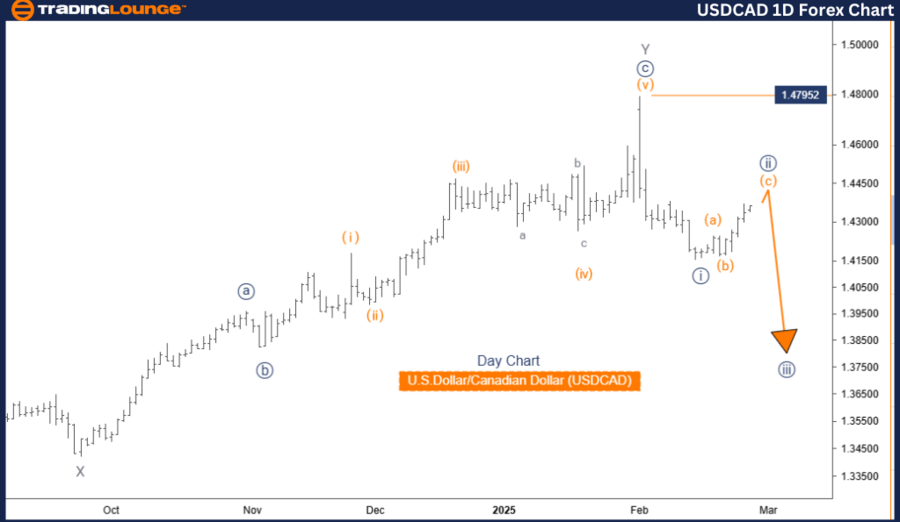
U.S. Dollar / Canadian Dollar (USDCAD) Elliott Wave Analysis – Trading Lounge Daily Chart
USDCAD Elliott Wave Technical Analysis
Function: Counter Trend
Mode: Corrective
Structure: Navy Blue Wave 2
Position: Gray Wave 1
Next Lower Degree: Navy Blue Wave 3
Wave Cancellation Level: 1.47952
USDCAD Elliott Wave Analysis Overview
The USDCAD Elliott Wave Analysis on the daily chart indicates a corrective market structure, suggesting that the currency pair is in a counter-trend phase within Navy Blue Wave 2, which is part of a larger Gray Wave 1. This setup signals that the market is experiencing an intermediate correction before continuing in the broader trend direction.
The next expected move is Navy Blue Wave 3, which should develop once Navy Blue Wave 2 is completed. Navy Blue Wave 1 appears to have finished, and now the market is forming Navy Blue Wave 2, expected to show corrective characteristics—potentially through sideways consolidation or a short-term upward retracement before transitioning into Navy Blue Wave 3.
The completion of Navy Blue Wave 2 is a crucial turning point, providing potential trading opportunities for the next impulsive phase.
Key Trading Considerations
Critical Price Level to Watch: 1.47952 (Wave Cancellation Level)
- If USDCAD breaks above this level, the current Elliott Wave count is invalidated, requiring a reassessment of the market structure.
- This level serves as a major resistance, and a breakout above it could indicate a trend shift or a new wave pattern formation.
Market Implications:
✅ Completion of Navy Blue Wave 2 → Potential entry for Navy Blue Wave 3, aligning with the larger trend.
✅ Corrective Movement Characteristics → Possible sideways movement or mild retracement before a stronger price move.
✅ Wave Structure Awareness → Helps traders anticipate market shifts and adjust their trading strategies accordingly.
Conclusion
The USDCAD market structure remains in a corrective phase, with Navy Blue Wave 2 developing after Navy Blue Wave 1. This phase belongs to Gray Wave 1, and the next significant movement is Navy Blue Wave 3. Traders should closely monitor the completion of Navy Blue Wave 2, as it will offer valuable insights into future price action.
Understanding Elliott Wave structures is essential for identifying market turning points and optimizing trading strategies. The 1.47952 level is a key reference point, acting as a wave cancellation threshold, which—if breached—could signal the need to reassess the wave count.
By studying wave dynamics and price action, traders can develop a data-driven approach to trading USDCAD using the Elliott Wave framework.
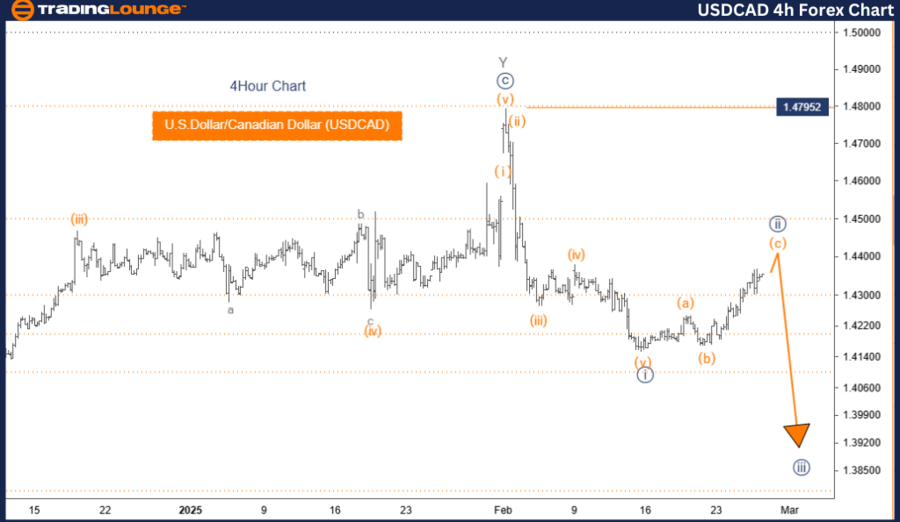
U.S. Dollar / Canadian Dollar (USDCAD) Elliott Wave Analysis – Trading Lounge 4-Hour Chart
USDCAD Elliott Wave Technical Analysis
Function: Counter Trend
Mode: Corrective
Structure: Navy Blue Wave 2
Position: Gray Wave 1
Next Lower Degree: Navy Blue Wave 3
Wave Cancellation Level: 1.47952
USDCAD Elliott Wave Analysis Overview
The USDCAD Elliott Wave Analysis on the 4-hour chart confirms a corrective market structure, indicating a counter-trend phase within Navy Blue Wave 2, which is part of a larger corrective pattern in Gray Wave 1. This suggests that the market is undergoing an intermediate correction before resuming the broader trend direction.
The next expected move is Navy Blue Wave 3, anticipated to emerge once Navy Blue Wave 2 completes. Navy Blue Wave 1 has already finished, and the market is now in Navy Blue Wave 2, which is showing corrective characteristics—including sideways consolidation or a short-term upward retracement before transitioning into Navy Blue Wave 3.
The completion of Navy Blue Wave 2 is a crucial pivot point, signaling the potential start of the next impulsive wave.
Key Trading Considerations
Critical Price Level to Watch: 1.47952 (Wave Cancellation Level)
- If USDCAD surpasses this level, the current wave count is invalidated, requiring a market reassessment.
- This price level acts as resistance, and a breakout above it could indicate a new trend direction or wave pattern shift.
Market Implications:
✅ Completion of Navy Blue Wave 2 → Could provide a buying opportunity as it signals the start of Navy Blue Wave 3.
✅ Corrective Movement Characteristics → Possible sideways price action or short-term retracement before a stronger price movement.
✅ Wave Structure Awareness → Helps traders plan for market shifts and adjust trading strategies accordingly.
Conclusion
The USDCAD market structure is currently in a corrective phase, with Navy Blue Wave 2 developing following the completion of Navy Blue Wave 1. This phase belongs to Gray Wave 1, and the next major move is Navy Blue Wave 3. Traders should carefully monitor the completion of Navy Blue Wave 2, as it will provide critical insights into the market’s next direction.
Understanding Elliott Wave theory is crucial for spotting market turning points and aligning trading strategies with potential price movements. The 1.47952 level remains a key threshold, serving as a wave cancellation marker that—if broken—suggests the need to reassess the wave count.
By analyzing wave structures and price movements, traders can take a data-driven approach to trading USDCAD under the Elliott Wave framework.
Technical Analyst: Malik Awais
Source: visit Tradinglounge.com and learn From the Experts Join TradingLounge Here
Previous: NZDUSD Elliott Wave Technical Analysis
VALUE Offer - Buy 1 Month & Get 3 Months!Click here
Access 7 Analysts Over 200 Markets Covered. Chat Room With Support