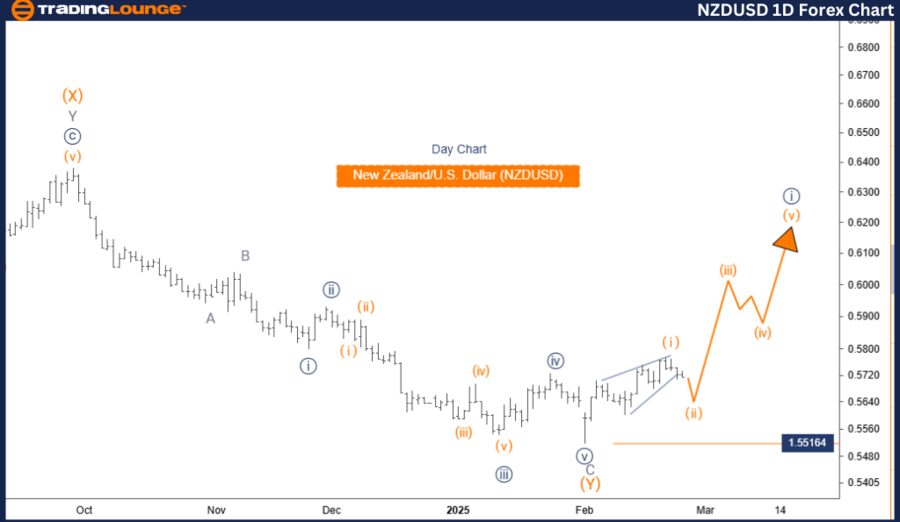
New Zealand Dollar / U.S. Dollar (NZDUSD) Elliott Wave Analysis – Trading Lounge Daily Chart
NZDUSD Elliott Wave Technical Analysis
Function: Counter Trend
Mode: Corrective
Structure: Orange Wave 2
Position: Navy Blue Wave 3
Direction Next Higher Degrees: Orange Wave 3
Wave Cancel Invalid Level: 0.55164
Analysis Details
The NZDUSD Elliott Wave Analysis on the daily chart indicates a counter-trend corrective phase within the broader market structure.
Currently, the market is positioned within Orange Wave 2, forming a corrective pattern within Navy Blue Wave 3. This structure suggests the market is undergoing an intermediate correction before continuing the primary trend.
The next major movement expected is Orange Wave 3, which is likely to start once the ongoing correction concludes.
Key Observations
- Orange Wave 1 appears completed, with the market now transitioning into Orange Wave 2.
- Wave 2 is expected to exhibit corrective characteristics, potentially including sideways or downward movement before the next impulsive wave (Orange Wave 3) begins.
- Completion of Orange Wave 2 is a crucial phase, as it will indicate the potential start of Orange Wave 3, which could push the market toward the broader trend direction.
Key Level to Watch
- Wave Cancellation Invalid Level: 0.55164
- If the price rises above this level, the current wave count will be invalid, requiring a market structure reassessment.
- This level serves as a critical resistance, and a breakout could signal a trend shift or wave pattern adjustment.
Conclusion
The NZDUSD remains in a corrective phase within its Elliott Wave structure, with Orange Wave 2 in progress following the completion of Orange Wave 1. This correction forms part of Navy Blue Wave 3, with the next expected move being Orange Wave 3.
Traders should monitor the completion of Orange Wave 2 closely, as it will provide valuable insights into the timing and direction of the upcoming wave structure.
Understanding Elliott Wave principles is essential for predicting potential market movements and aligning trading strategies accordingly.
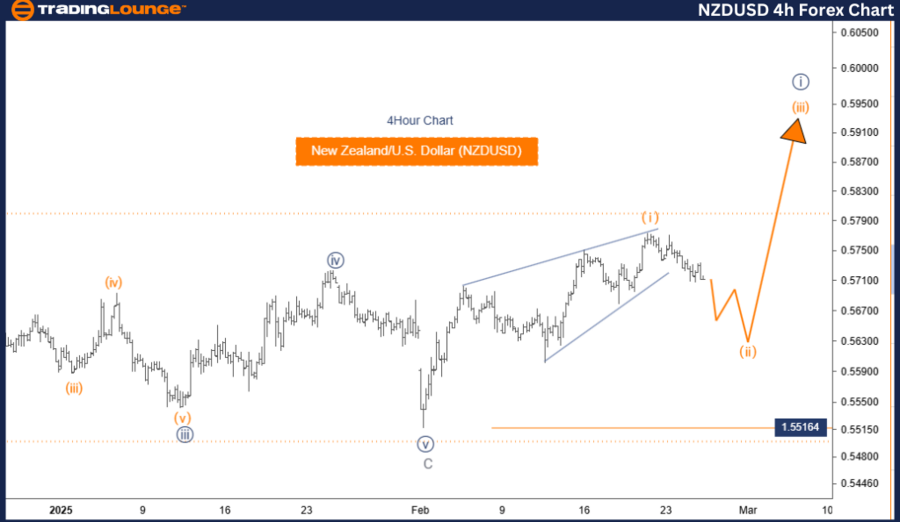
New Zealand Dollar / U.S. Dollar (NZDUSD) Elliott Wave Analysis – Trading Lounge 4-Hour Chart
NZDUSD Elliott Wave Technical Analysis
Function: Counter Trend
Mode: Corrective
Structure: Orange Wave 2
Position: Navy Blue Wave 3
Direction Next Higher Degrees: Orange Wave 3
Wave Cancel Invalid Level: 0.55164
Analysis Details
The NZDUSD Elliott Wave Analysis on the 4-hour chart highlights a counter-trend corrective structure.
Current market conditions indicate that Orange Wave 2 is developing within Navy Blue Wave 3, reinforcing the expectation of an intermediate correction before the primary trend resumes.
The next anticipated move is Orange Wave 3, which is projected to follow the conclusion of this corrective phase.
Key Observations
- Orange Wave 1 has been completed, and the market is transitioning into Orange Wave 2.
- Wave 2 is expected to be corrective, with sideways or downward movement before the next impulsive wave (Orange Wave 3) takes shape.
- Completion of Orange Wave 2 is critical, as it may signal the beginning of Orange Wave 3, a move that could push the market in the broader trend direction.
Key Level to Watch
- Wave Cancellation Invalid Level: 0.55164
- If the price exceeds this level, the current wave count becomes invalid, requiring a market reassessment.
- This level functions as a key resistance, and a break above it could suggest a trend shift or wave pattern adjustment.
Conclusion
The NZDUSD is in a corrective phase, with Orange Wave 2 developing after Orange Wave 1. This correction is part of Navy Blue Wave 3, with the next major movement expected to be Orange Wave 3.
Traders should focus on the completion of Orange Wave 2, as it provides valuable insights into the direction and timing of the next wave movement.
Understanding Elliott Wave structures plays a crucial role in forecasting price movements and developing effective trading strategies.
Technical Analyst: Malik Awais
Source: visit Tradinglounge.com and learn From the Experts Join TradingLounge Here
Previous: AUDUSD Elliott Wave Technical Analysis
VALUE Offer - Buy 1 Month & Get 3 Months!Click here
Access 7 Analysts Over 200 Markets Covered. Chat Room With Support