17Jul

Bitcoin / U.S. Dollar (BTCUSD) Elliott Wave Analysis: Bitcoin Daily & H4 Impulse, Fibonacci 1.618 Resistance & Swing Trade

Bitcoin / U.S. Dollar (BTCUSD) Elliott Wave Analysis – TradingLounge Daily Chart

BTCUSD Elliott Wave Technical Analysis

Function: Follow Trend

Mode: Motive

Structure: Impulse

Position: Wave 1

Wave Cancel Invalid Level: Not Specified

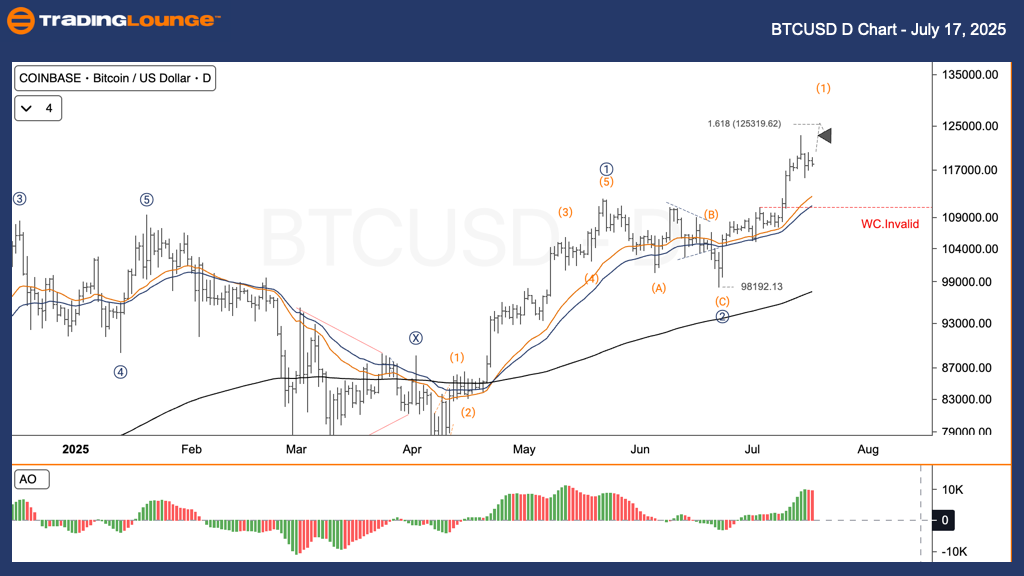
Bitcoin Price Analysis and Strategy – Daily Timeframe
Bitcoin (BTCUSD) is progressing through an impulsive bullish wave (1) since surpassing the W–X–Y corrective structure in April. Currently, it's approaching the critical resistance, known as the Fibonacci 1.618 extension zone—frequently where impulse waves encounter strong selling pressure. The wave (1) rally initiated from the post-correction low of 74,773.69 and has been forming a clean 5-wave pattern: sub-waves 1–2–3–4–5. The current market activity is unfolding in the final leg of this wave (1) pattern.

Trading Strategy for BTCUSD
✅ Short-Term Strategy (Swing Trading)

Watch closely for the formation of wave (2). If wave (2) consolidates near strong support levels, it may provide a strategic buy opportunity aligned with the broader bullish momentum.

🟥 Wave Count Invalidation
If BTCUSD drops below 98,192.13, the current Elliott Wave count becomes invalid, requiring a fresh structural analysis.

BTCUSD-d-crypto-char...


Bitcoin / U.S. Dollar (BTCUSD) Elliott Wave Analysis – TradingLounge H4 Chart

BTCUSD Elliott Wave Technical Analysis

Function: Follow Trend

Mode: Motive

Structure: Impulse

Position: Wave V

Wave Cancel Invalid Level: Not Specified

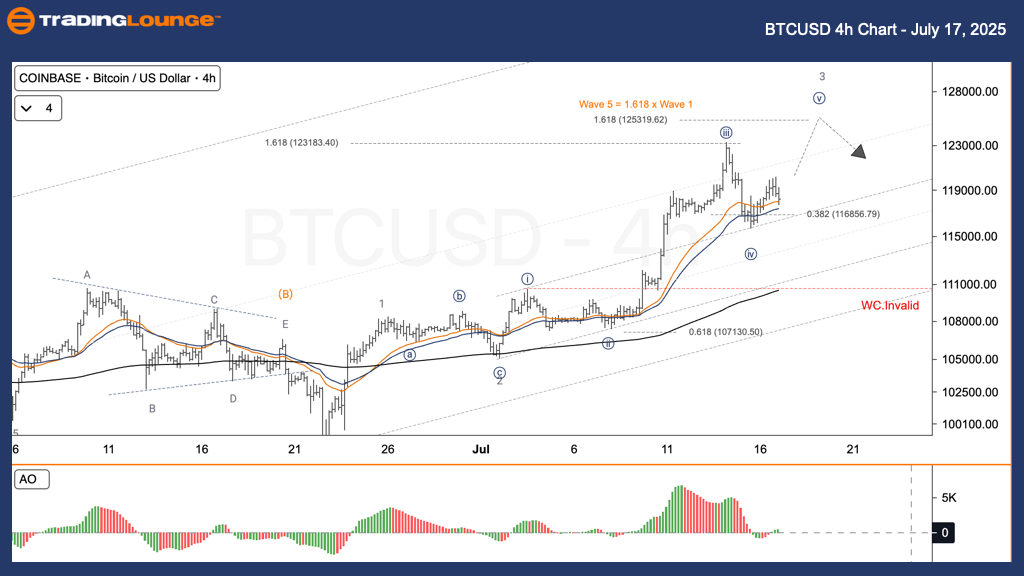
Bitcoin Price Outlook and Strategy – 4-Hour Chart
Bitcoin continues its bullish impulse structure in the 4-hour chart. The cryptocurrency is now within wave iv of the broader wave (1), setting the stage for a possible push higher via wave v. Wave iii has already peaked above $122,000, and wave iv is undergoing a corrective phase. Current support aligns closely with the 0.382 Fibonacci retracement at 118,656.79, a key technical level.

BTCUSD Swing Trade Strategy
✅ Short-Term Strategy (Swing Trading)

Anticipate a potential bounce from the wave iv support zone. This could provide a favorable entry point into wave v for bullish continuation.

🟥 Wave Count Invalidation
(No specific invalidation level has been defined for this chart setup.)

Technical Analyst: Kittiampon Somboonsod, CEWA

Source: Visit Tradinglounge.com and learn from the Experts. Join TradingLounge Here

Previous: VETUSD Elliott Wave Technical Analysis

VALUE Offer - Buy 1 Month & Get 3 Months!Click here

Access 7 Analysts Over 200 Markets Covered. Chat Room With Support

BTCUSD-4h-crypto-cha...

Related

Comprehensive Elliott Wave Technical Forecast:  Analog Devices Inc. (ADI) Stocks

Comprehensive Elliott Wave Technical Forecast: Analog Devices Inc. (ADI) Stocks

Dive into our detailed Elliott Wave analysis of Analog Devices Inc. (ADI) as of June 2024. This repo...

Read More >
Gold (XAUUSD) Elliott Wave Technical Analysis: Points to a Potential Surge to $2200

Gold (XAUUSD) Elliott Wave Technical Analysis: Points to a Potential Surge to $2200

our analysis suggests a favorable outlook for Gold, presenting potential buying opportunities for tr...

Read More >
Euro/British Pound(EURGBP) 4 Hour Chart EURGBP Elliott Wave Technical Analysis 13 October 23

Euro/British Pound(EURGBP) 4 Hour Chart EURGBP Elliott Wave Technical Analysis 13 October 23

The EUR/GBP Elliott Wave Analysis for 13 October 23, serves as a valuable guide for traders and inve...

Read More >
ITC Stock Elliott Wave Analysis: Forecasting Share Price Correction in Wave C and Strategic Trading Setup for FMCG Investors

ITC Stock Elliott Wave Analysis: Forecasting Share Price Correction in Wave C and Strategic Trading Setup for FMCG Investors

Get a full Elliott Wave analysis of ITC India, covering wave structures, correction phase, and price...

Read More >
Elliott Wave Analysis and Stock Forecast for Suncorp Group Limited (ASX: SUN) with Technical Chart Insights and Market Outlook

Elliott Wave Analysis and Stock Forecast for Suncorp Group Limited (ASX: SUN) with Technical Chart Insights and Market Outlook

Elliott Wave analysis of ASX: Suncorp Group Limited (SUN) provides an expert view of current market ...

Read More >

$1 for 2 Weeks

then $29 a month!

What a Special Offer!

Trade Recommendations

Unleash the power of deversified trading with our comprehensive portfolio, covering 250+ markets:

  • Stock Trades
  • Crypto Trades
  • Forex Trades
  • Commodity Trades
Elliott Wave Analysis

Gain a competitive edge with expert insights and AI-powered Elliott Wave charting into:

  • Global Indices
  • US Stocks & ASX Stocks
  • Forex & Crypto
  • Commodities
Top-Notch Trading Tools

Equip yourself with the tools of success:

  • Real-time Chat rooms
  • Elliott Wave Algorithm
  • Portfolio tools
  • TradingLevels
  • Screener
  • Trading Game
7 Elliott Wave Analysts

Stay ahead of the market with daily charts and insightful videos
Your secret to strategic trading!

JOIN HERE


Welcome to TradingLounge (ASIC A.R.No. 321187), specialists in trades, trading education and technical analysis, covering stocks, indices, commodities, forex and cryptocurrencies.

When you join TradingLounge you have access to everything we offer, including trade tools, educational content and a social platform to chat with like-minded investors.

Read more

@Copyright 2024 by tradinglounge.com

Contact Us

Australian no: 02 4787 6020

International no: +61 (2) 47876020

Pay with:

Find us on