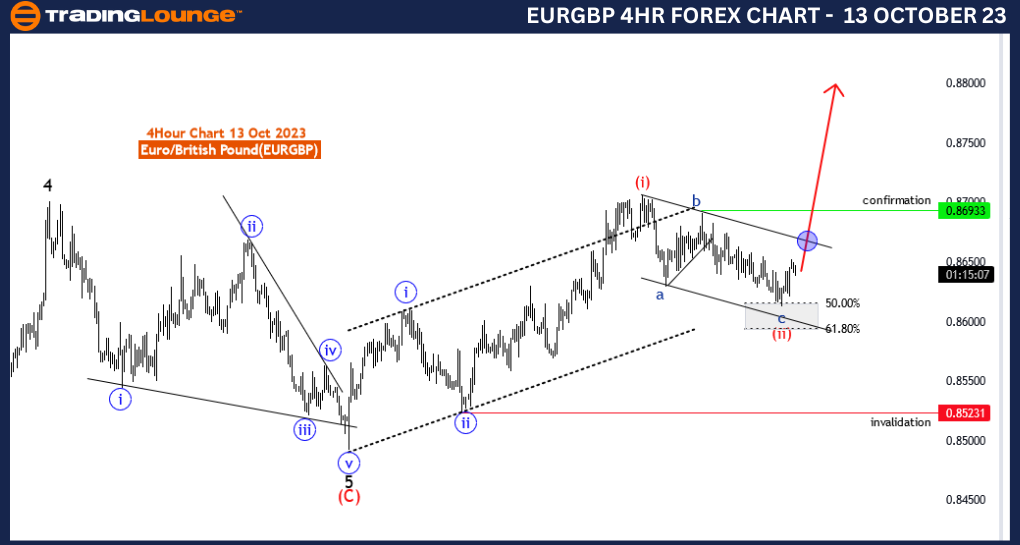
EURGBP Elliott Wave Analysis Trading Lounge 4 Hour Chart, 13 October 23
Euro/British Pound(EURGBP) 4 Hour Chart
EURGBP Elliott Wave Technical Analysis
Function: Trend
Mode: impulsive
Structure: 3 of 3
Position: Blue Wave 3
Direction Next higher Degrees: wave 3 of 3 started
Details: red wave 2 of 3 completed between fib level 50.00 to 61.80, now 3 of 3 in play. Wave Cancel invalid level: 0.85231
The EUR/GBP Elliott Wave Analysis on the 4-hour chart, dated 13 October 23, is an essential guide for traders and investors in the Euro/British Pound (EUR/GBP) currency pair. The analysis is framed within the context of the Elliott Wave theory, a powerful tool for understanding market trends and price movements.
In this analysis, the primary function is to identify and ride the prevailing trend. The analysis characterizes the market as being in a trend mode, specifically an "impulsive" one. Impulsive waves are typically associated with strong, directional price movements. The structure under examination is "3 of 3," which implies a thorough examination of the third wave within a broader Elliott Wave sequence. The third wave in Elliott Wave theory is often the longest and most powerful, making it of great interest to traders.
The position is denoted as "blue wave 3," indicating that the analysis is concentrating on this particular wave within the larger wave structure. This is significant as it helps traders focus on the exact wave that is currently in play and likely to be influencing price movements. The analysis notes that "wave 3 of 3 started," suggesting that a strong and sustained trend may be underway.
An essential detail provided is that "red wave 2 of 3" has completed its course, and it did so between the Fibonacci levels of 50.00 and 61.80. Understanding the completion of corrective waves like "red wave 2 of 3" is pivotal for traders, as it signals the potential beginning of a powerful impulsive wave.
The "Wave Cancel invalid level" for this analysis is determined at 0.85231. This level serves as an important reference point for traders to assess the effectiveness of their trading strategies and manage risk properly.
To summarize, this EUR/GBP Elliott Wave Analysis for 13 October 23, presents a valuable outlook on the current state of the market. It confirms the emergence of a significant impulsive wave, namely "3 of 3," and provides a clear perspective on the completion of a corrective wave, "red wave 2 of 3." Traders are encouraged to consider this analysis to make informed trading decisions in the EUR/GBP currency pair.
Technical Analyst: Malik Awais
Source: Tradinglounge.com get trial here!
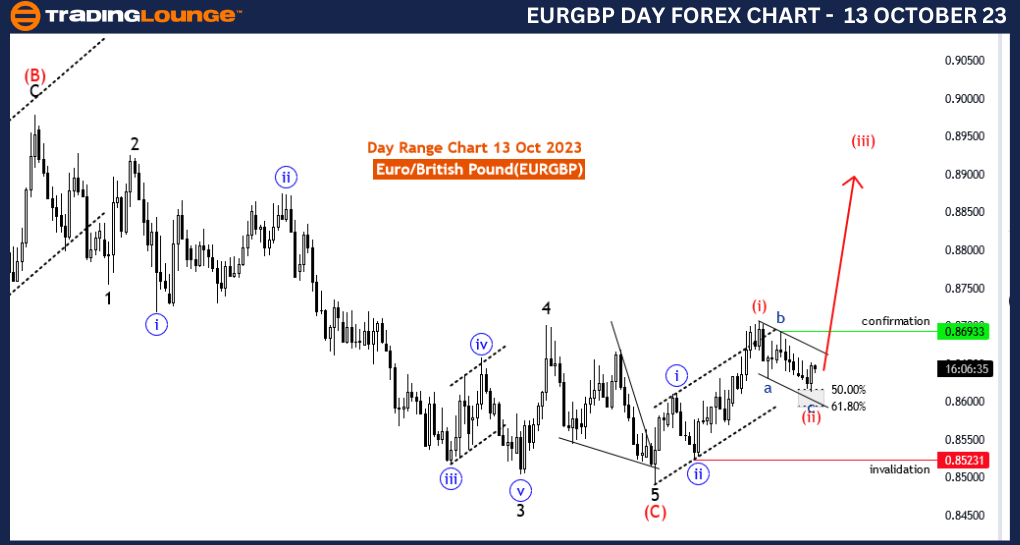
EURGBP Elliott Wave Analysis Trading Lounge Day Chart, 13 October 23
Euro/British Pound(EURGBP) Day Chart
EURGBP Elliott Wave Technical Analysis
Function: Trend
Mode: impulsive
Structure: 3 of 3
Position: Blue Wave 3
Direction Next higher Degrees: wave 3 of 3 started
Details: red wave 2 of 3 completed between fib level 50.00 to 61.80, now 3 of 3 in play. Wave Cancel invalid level: 0.85231
The EUR/GBP Elliott Wave Analysis on the daily chart, dated 13 October 23, provides a comprehensive insight into the market dynamics of the Euro/British Pound (EUR/GBP) currency pair. This analysis is rooted in the Elliott Wave theory, a renowned methodology for understanding market trends and price movements.
The primary purpose of this analysis is to recognize and ride the prevailing trend in the EUR/GBP market. It categorizes the market's function as trending and, more specifically, impulsive. Impulsive waves in Elliott Wave theory are associated with strong, sustained price movements, which can offer significant opportunities for traders.
The analysis zeroes in on the third wave within the broader wave structure, identified as "3 of 3." In Elliott Wave theory, the third wave is typically the longest and most powerful within a sequence, making it a focal point for traders and investors seeking significant price movements.
The specific wave under scrutiny is "blue wave 3," indicating the current wave's importance in driving price action. The analysis declares that "wave 3 of 3 started," suggesting that a potent and extended trend is potentially underway.
A critical detail provided in this analysis is the completion of "red wave 2 of 3" between the Fibonacci levels of 50.00 and 61.80. This is a crucial observation because it suggests the possible initiation of a powerful impulsive wave. These Fibonacci levels are often seen as critical levels of support and resistance, influencing traders' decisions.
The "Wave Cancel invalid level" for this analysis is pinpointed at 0.85231. This level serves as a valuable reference for traders to monitor and adjust their trading strategies and risk management.
In summary, the EUR/GBP Elliott Wave Analysis for 13 October 23, serves as a valuable guide for traders and investors in the EUR/GBP market. It confirms the presence of a significant impulsive wave, "3 of 3," and highlights the completion of a corrective wave, "red wave 2 of 3," providing insights into the potential onset of a powerful impulsive wave. Traders and investors should consider this analysis when making trading decisions in the EUR/GBP currency pair.