02Jun

Elliott Wave Analysis of SGX TSI Iron Ore Futures: Unveiling Commodity Market Trends, Price Forecasts, and Trading Strategies

SGX TSI Iron Ore Elliott Wave Technical Forecast – Trading Lounge Analysis

SGX TSI Iron Ore CFR China (62% Fe Fines) Index Futures

The SGX TSI Iron Ore Futures contract, listed on the Singapore Exchange (SGX), reflects iron ore with 62% iron content shipped to China. It serves as a global benchmark for pricing in the iron ore futures market.

Market Overview and Current Price Action

Since October 2024, SGX TSI Iron Ore Futures have shown uneven movement. After a strong rally earlier in that month, prices began to reverse, initiating a corrective phase. Recent chart patterns suggest the development of a potential Elliott Wave structure that could produce further price volatility in both upward and downward directions in the near term.

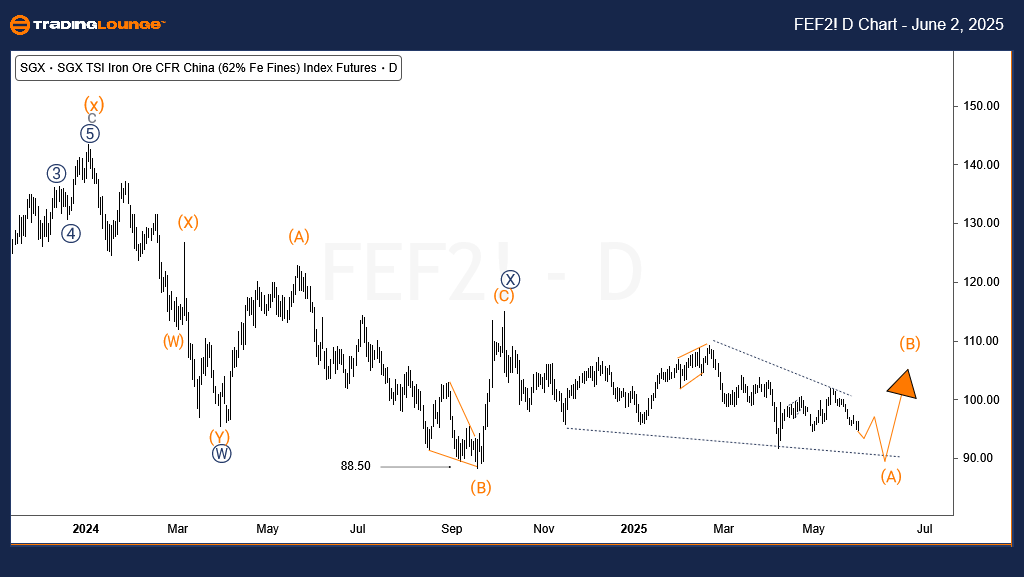
SGX TSI Daily Elliott Wave Chart Overview

In the broader trend, the index is undergoing a double zigzag corrective pattern beginning from its May 2021 high of approximately $234. This high was followed by a steep drop that reached about $74 in October 2022, completing the first zigzag wave.

Subsequently, the market rallied again in another zigzag, peaking at $153.5 in January 2024. The latest leg reflects another zigzag correction, contributing to a complex (w)-(x)-(y) wave structure. Wave (y) is still unfolding, with downside projections suggesting a potential move toward $45 in the upcoming sessions or months.

SGX-TSI-Iron-Ore-Com...


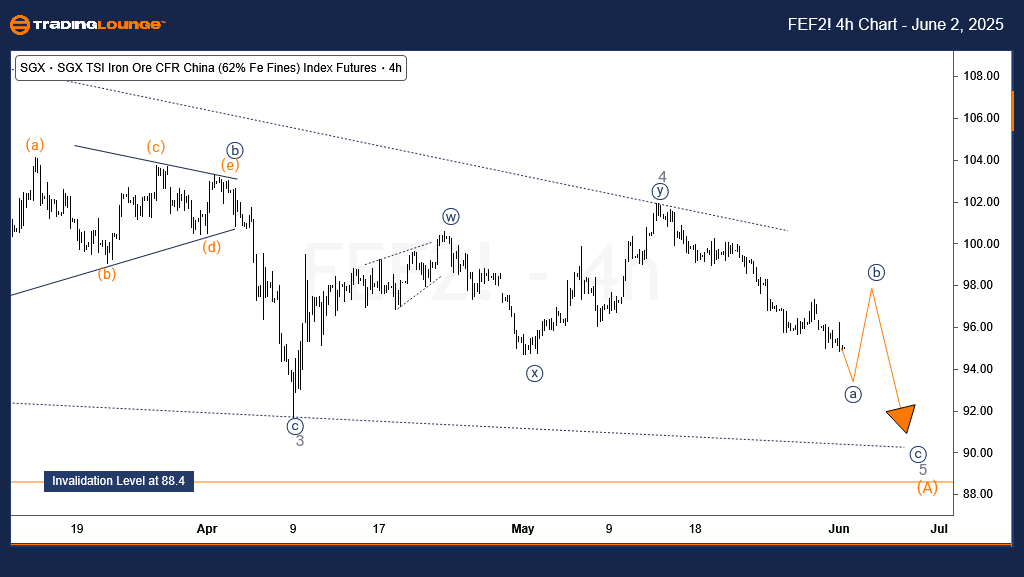
SGX TSI 4-Hour (H4) Elliott Wave Chart Insights

On the H4 timeframe, the price action from October 2024 resembles a leading diagonal, which could be wave (A) of ((Y)) of w of (y). Once this diagonal ends, a countertrend bounce as wave (B) may develop, followed by a final push lower in wave (C) of ((Y)). This pattern indicates a bearish trend continuation scenario.

As long as prices remain below key resistance levels at $115 and $143.5, the bearish setup holds. Traders should look for selling opportunities after corrective rallies and closely monitor resistance zones for signs of renewed downward pressure.

Technical Analyst: Sanmi Adeagbo

Source: Visit Tradinglounge.com and learn from the Experts. Join TradingLounge Here 

See Previous: Cocoa Elliott Wave Technical Analysis

VALUE Offer - Buy 1 Month & Get 3 Months!Click here

Access 7 Analysts Over 200 Markets Covered. Chat Room With Support

SGX-TSI-Iron-Ore-Com...

Related

WTI Elliott Wave Analysis Revealing Crude Oil Price Trends, Key Support Levels, Bearish Breakouts, and Technical Outlook

WTI Elliott Wave Analysis Revealing Crude Oil Price Trends, Key Support Levels, Bearish Breakouts, and Technical Outlook

This analysis delves into WTI crude oil price movements using Elliott Wave theory. It highlights the...

Read More >
U.S. Dollar / Japanese Yen (USDJPY) Elliott Wave Analysis: Forex Market Trends & Technical Analysis for Better Trading Decisions

U.S. Dollar / Japanese Yen (USDJPY) Elliott Wave Analysis: Forex Market Trends & Technical Analysis for Better Trading Decisions

USDJPY Elliott Wave analysis examines the current Forex market trends using the Elliott Wave theory....

Read More >
Elliott Wave Analysis for Dogecoin (DOGEUSD): Short-Term Price Forecast, Trade Strategy, Wave 3 Setup & Resistance Insights

Elliott Wave Analysis for Dogecoin (DOGEUSD): Short-Term Price Forecast, Trade Strategy, Wave 3 Setup & Resistance Insights

Elliott Wave analysis for Dogecoin (DOGEUSD), detailing the current impulsive wave structure, predic...

Read More >
Understand How the Elliott Wave Structure is Shaping Dogecoin's Future Movements: DOGEUSD Technical Analysis

Understand How the Elliott Wave Structure is Shaping Dogecoin's Future Movements: DOGEUSD Technical Analysis

This article provides a comprehensive Elliott Wave analysis for Dogecoin (DOGEUSD), including a deta...

Read More >
Larsen & Toubro Elliott Wave Analysis Reveals Bullish Impulse Wave Formation on Daily and Weekly Charts with Key Trading Levels

Larsen & Toubro Elliott Wave Analysis Reveals Bullish Impulse Wave Formation on Daily and Weekly Charts with Key Trading Levels

Larsen & Toubro is forming a bullish Elliott Wave pattern, with impulse waves in development on dail...

Read More >
Exxon Mobil Inc.(XOM) Stocks Elliott Wave Technical Analysis: Provides Traders with detailed insights

Exxon Mobil Inc.(XOM) Stocks Elliott Wave Technical Analysis: Provides Traders with detailed insights

Our latest Elliott Wave analysis for Exxon Mobil Inc. (XOM) provides traders with detailed insights ...

Read More >

$1 for 2 Weeks

then $29 a month!

What a Special Offer!

Trade Recommendations

Unleash the power of deversified trading with our comprehensive portfolio, covering 250+ markets:

  • Stock Trades
  • Crypto Trades
  • Forex Trades
  • Commodity Trades
Elliott Wave Analysis

Gain a competitive edge with expert insights and AI-powered Elliott Wave charting into:

  • Global Indices
  • US Stocks & ASX Stocks
  • Forex & Crypto
  • Commodities
Top-Notch Trading Tools

Equip yourself with the tools of success:

  • Real-time Chat rooms
  • Elliott Wave Algorithm
  • Portfolio tools
  • TradingLevels
  • Screener
  • Trading Game
7 Elliott Wave Analysts

Stay ahead of the market with daily charts and insightful videos
Your secret to strategic trading!

JOIN HERE


Welcome to TradingLounge (ASIC A.R.No. 321187), specialists in trades, trading education and technical analysis, covering stocks, indices, commodities, forex and cryptocurrencies.

When you join TradingLounge you have access to everything we offer, including trade tools, educational content and a social platform to chat with like-minded investors.

Read more

@Copyright 2024 by tradinglounge.com

Contact Us

Australian no: 02 4787 6020

International no: +61 (2) 47876020

Pay with:

Find us on