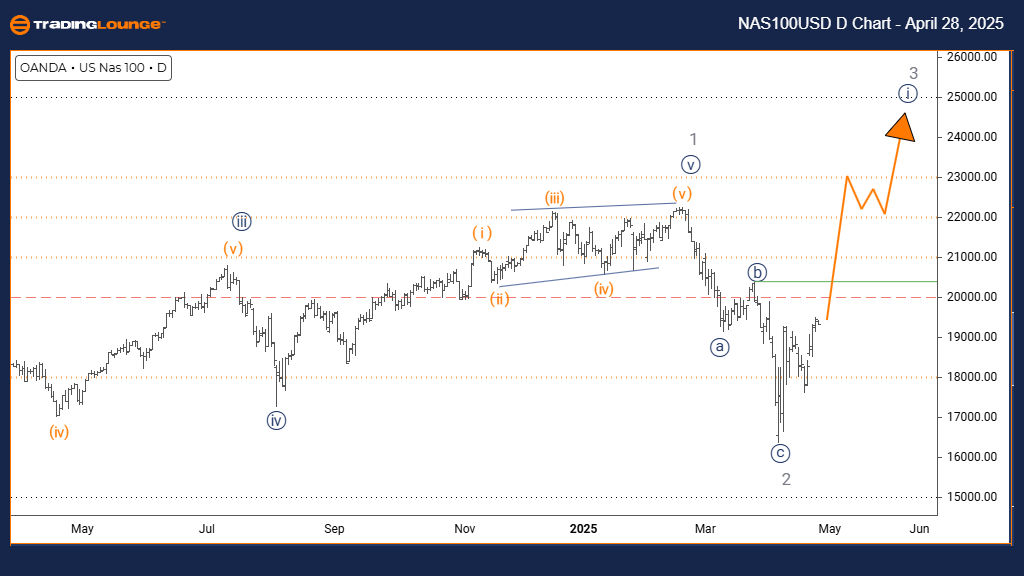
NASDAQ Elliott Wave Analysis | Trading Lounge Day Chart
NASDAQ Index Daily Chart Analysis
NASDAQ Elliott Wave Technical Analysis
Function: Bullish Trend
Mode: Impulsive
Structure: Navy Blue Wave 1
Position: Gray Wave 3
Direction Next Lower Degrees: Navy Blue Wave 2
Details:
Gray wave 2 correction appears complete, with navy blue wave 1 of 3 now advancing.
The NASDAQ daily Elliott Wave analysis reveals a bullish trend unfolding through an impulsive wave structure. Following the completion of gray wave 2, the index has begun developing navy blue wave 1 within the broader gray wave 3. This transition signals the beginning of a potential strong upward movement, presenting early opportunities for traders focusing on bullish setups.
Navy Blue Wave 1 Progression
Navy blue wave 1 represents the initial stage of this new impulsive sequence, often characterized by growing strength and momentum. The successful completion of the gray wave 2 correction lays a strong foundation for wave 1’s gradual ascent. Early-stage impulsive moves typically show moderate yet steady price advances, setting the tone for more aggressive action in future waves.
The formation of gray wave 3 at a higher degree suggests increasing bullish momentum ahead. Monitoring the daily time frame becomes critical, as navy blue wave 1 provides the first phase of opportunity within a larger bullish trend. Traders should prepare for tactical positioning to capture potential medium-term gains.
Trading Strategy and Market Outlook
During navy blue wave 1, traders should watch for classic impulse traits, such as rising volume and consistent price trends. While growth may be moderate in this phase, it lays the groundwork for a stronger bullish rally. Technical indicators confirming upward momentum will be key to validating the evolving Elliott Wave structure.
After navy blue wave 1 concludes, a corrective navy blue wave 2 is expected, offering a potential pullback and re-entry opportunity. Active monitoring of price structures and momentum shifts will be essential to identify this transition and to prepare for the larger wave 3 rally.
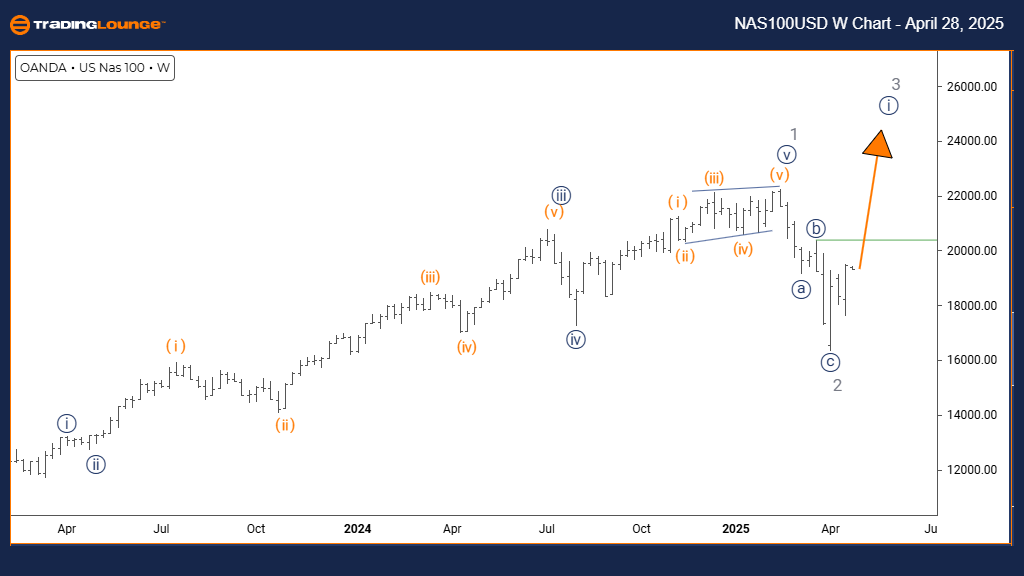
NASDAQ Index Elliott Wave Analysis - TradingLounge Weekly Chart
NASDAQ Elliott Wave Technical Analysis
Function: Bullish Trend
Mode: Impulsive
Structure: Navy Blue Wave 1
Position: Gray Wave 3
Direction Next Lower Degrees: Navy Blue Wave 2
Details:
Gray wave 2 appears complete, and navy blue wave 1 of 3 is currently progressing.
The NASDAQ weekly Elliott Wave analysis highlights a bullish setup developing through an impulsive wave structure. After finalizing the gray wave 2 correction, the index has transitioned into navy blue wave 1, marking the initial stage of a broader gray wave 3 impulse. This structure indicates the early formation of a strong upward trend with significant upside potential over the coming weeks.
Navy Blue Wave 1 Development
Navy blue wave 1 initiates the impulsive sequence, usually accompanied by gradual but firm price advancements as market sentiment turns positive. The successful completion of the gray wave 2 correction creates ideal conditions for wave 1 to unfold steadily. This phase often precedes stronger and more aggressive moves typical of later impulse waves.
The overall structure points toward the emergence of a powerful gray wave 3, typically the most dynamic and extended phase in Elliott Wave theory. Observing early wave 1 signals such as increasing volume and strengthening momentum indicators will be critical for traders aiming to align with the developing trend.
Trading Strategy and Market Outlook
As navy blue wave 1 progresses towards completion, traders should anticipate a corrective navy blue wave 2 before the uptrend resumes into wave 3. The weekly analysis suggests that this phase offers strategic positioning opportunities for medium- to long-term trend-following strategies. Close attention to technical setups and Elliott Wave confirmation patterns will help traders capture significant movements within this evolving bullish trend.
Technical Analyst: Malik Awais
Source: Visit Tradinglounge.com and learn from the Experts. Join TradingLounge Here
Previous: Bovespa Index Elliott Wave Technical Analysis
VALUE Offer - Buy 1 Month & Get 3 Months!Click here
Access 7 Analysts Over 200 Markets Covered. Chat Room With Support