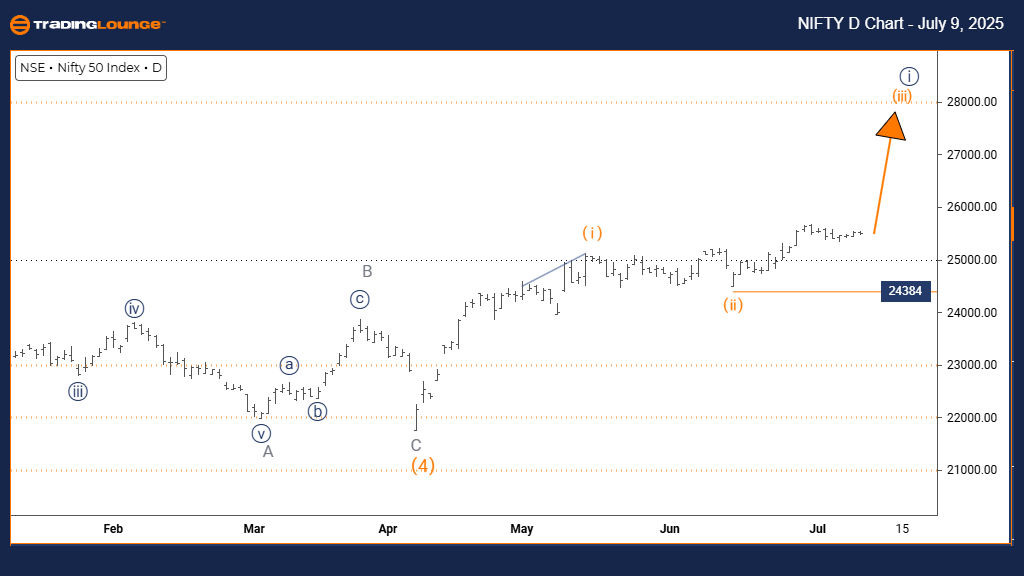
NIFTY 50 Elliott Wave Analysis Trading Lounge Day Chart
NIFTY 50 INDEX Wave Technical Analysis
FUNCTION: Bullish Trend
MODE: Impulsive
STRUCTURE: Orange Wave 3
POSITION: Navy Blue Wave 1
DIRECTION NEXT HIGHER DEGREES: Orange Wave 3 (Initiated)
DETAILS: Completion of Orange Wave 2 confirmed; Orange Wave 3 underway.
Wave Cancel Invalid Level: 24384
The NIFTY 50 Index daily chart reflects a clear bullish trend based on Elliott Wave Theory. The chart illustrates an impulsive wave structure, where Orange Wave 3 is actively progressing within Navy Blue Wave 1, indicating a potential for further upward price extension.
At a higher wave degree, Orange Wave 3 has likely begun, following the apparent conclusion of Orange Wave 2. This shift signals growing bullish strength, evident from increased buying momentum. Should the price fall below 24384, this wave setup would be invalidated, suggesting a shift to bearish sentiment.
The positioning within Navy Blue Wave 1 suggests that the index could be entering a larger bullish cycle, contingent on price holding above the invalidation threshold. As long as the wave count remains intact, the market outlook remains positive. Upon completion of Orange Wave 3, traders should prepare for a corrective Orange Wave 4. For now, the main focus is tracking the evolution of the current impulsive wave.
Given the use of a daily timeframe, this analysis carries broader significance, reflecting institutional trading patterns. Wave 3 often delivers the strongest price action in any Elliott Wave sequence, typically marked by sharp upward movement.
Traders are advised to watch key support and resistance levels. Historically, Wave 3 structures offer attractive risk-reward trade setups. The current market formation provides technical insight into trend direction, with bullish momentum supported as long as the index stays above 24384.
With Orange Wave 2 completed, this may serve as a launchpad for extended gains. Traders may consider long trades, provided the Elliott Wave structure continues to hold.
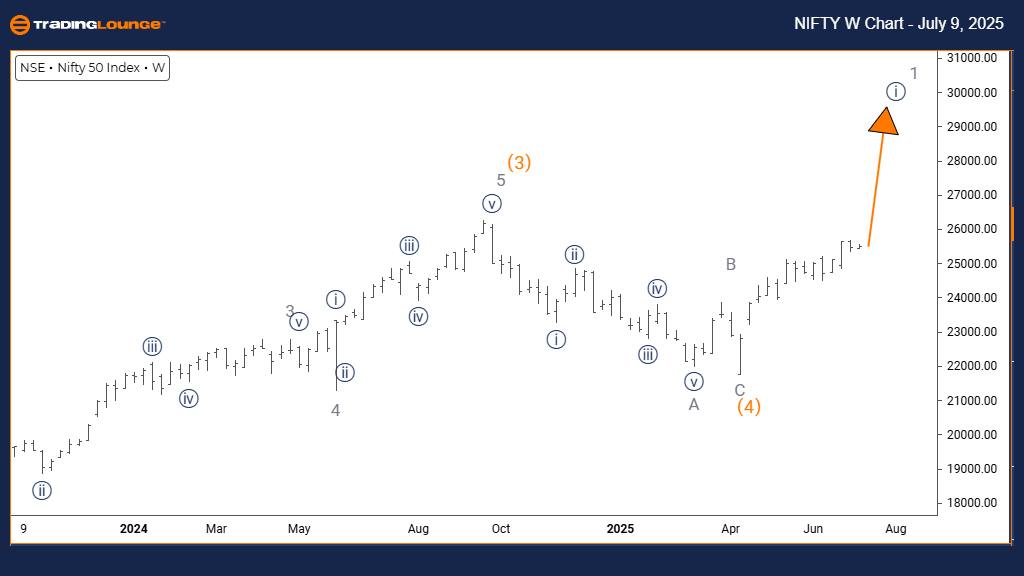
NIFTY 50 Elliott Wave Analysis Trading Lounge Weekly Chart
NIFTY 50 INDEX Wave Technical Analysis
FUNCTION: Bullish Trend
MODE: Impulsive
STRUCTURE: Navy Blue Wave 1
POSITION: Gray Wave 1
DIRECTION NEXT LOWER DEGREES: Navy Blue Wave 2
DETAILS: Orange Wave 4 has completed; Navy Blue Wave 1 is forming within Gray Wave 1.
The NIFTY 50 weekly chart continues to show a bullish wave pattern under the Elliott Wave framework. The current movement is part of Navy Blue Wave 1, developing inside Gray Wave 1, indicating the initial phase of a broader bullish trend.
Orange Wave 4 appears finalized, and the market is now within Navy Blue Wave 1, which typically begins a major upward cycle. This progression aligns with increased market activity and supports the view of a long-term uptrend, as long as the current wave structure holds.
The weekly timeframe adds depth to the analysis, showing alignment with institutional flows and broad market sentiment. If validated, this structure sets the groundwork for a sustained rally. Following the expected completion of this wave, a corrective Navy Blue Wave 2 is likely, which could temporarily reverse some gains.
Traders should remain attentive to the unfolding impulsive behavior and prepare for potential volatility as Wave 2 develops. This Elliott Wave setup outlines the broader directional movement, despite interim pullbacks.
Post Wave 2, a strong Wave 3 would be expected—often the most volatile and profitable stage. The recent end of Orange Wave 4 has laid a structural foundation for the ongoing move. Long-term traders may find this phase particularly suitable for aligning with macro trends.
The chart suggests the NIFTY 50 index is transitioning from correction to a new impulsive leg. Close tracking of Navy Blue Wave 1 and the emergence of Wave 2 will be essential in maintaining the current bullish bias.
Technical Analyst: Malik Awais
Source: Visit Tradinglounge.com and learn from the Experts. Join TradingLounge Here
Previous: Hang Seng Elliott Wave Technical Analysis
VALUE Offer - $1 for 2 Weeks then $29 a month!Click here
Access 7 Analysts Over 200 Markets Covered. Chat Room With Support