Elliott Wave Analysis for Theta Token (THETAUSD) - Daily and 4-Hour Insights
In today's financial landscape, Theta Token (THETAUSD) continues to capture the attention of savvy investors and traders alike. Utilizing the precision of Elliott Wave Analysis, we delve into the current dynamics and future possibilities of THETAUSD, offering an insightful perspective on its market movements.
THETAUSD Elliott Wave Technical Analysis: Daily Chart Insights
Theta Token/ U.S. dollar(THETAUSD) Daily Chart Analysis
THETAUSD Elliott Wave Technical Analysis
Function: Counter Trend
Mode: Corrective
Structure: Flat
Position: Wave ((B))
Next Higher Degrees Direction: Wave I of Impulse
Wave Cancellation Invalid Level: Not Specified
Key Details: The correction of Wave 4 tends towards a 38.2% retracement of Wave 3.
THETAUSD Trading Strategy
As of April 2, 2024, Theta Token remains on an upward trajectory, showcasing the characteristics of an impulse movement. Currently, in the midst of a fourth wave correction, the anticipation grows for a resurgence in the fifth wave. The current correction phase sees THETAUSD potentially testing the 2.168 level, presenting a strategic opportunity to rejoin the trend upon completion of the correction.
THETAUSD Technical Indicators:
- The price positioning above the MA200 signals a sustained uptrend.
- A bullish momentum is indicated by the Wave Oscillator, suggesting continued positive movement.

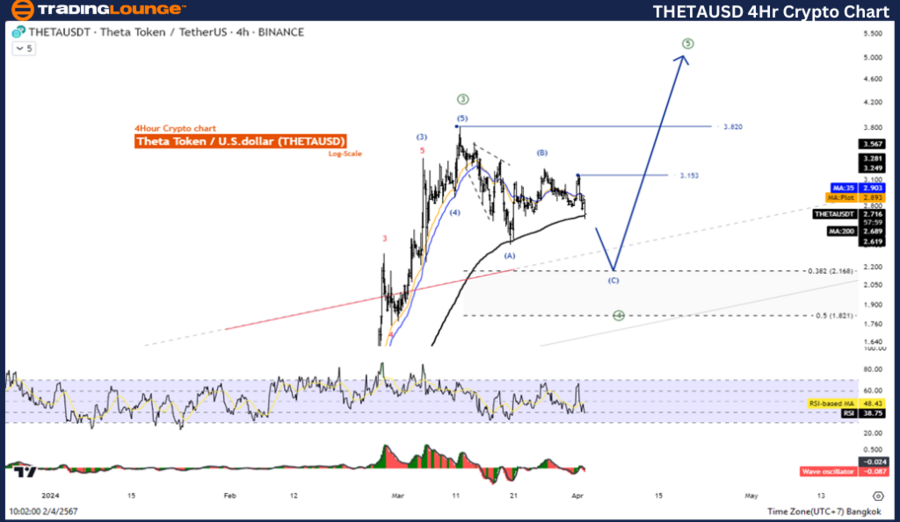
Elliott Wave Technical Analysis of THETAUSD: 4-Hour Chart Overview
Theta Token/ U.S. dollar(THETAUSD) 4-Hour Chart Analysis
THETAUSD Elliott Wave Technical Analysis
Function: Counter Trend
Mode: Corrective
Structure: Flat
Position: Wave ((B))
Next Higher Degrees Direction: Wave I of Impulse
Wave Cancellation Invalid Level: Not Specified
Insightful Details: The corrective pattern of Wave 4 aligns with a 38.2% retracement of Wave 3, mirroring the insights seen in the daily chart.
THETAUSD Trading Strategy on the 4-Hour Frame
Maintaining its bullish momentum, Theta Token indicates a promising continuation of its uptrend. The ongoing correction within the fourth wave offers a pivotal moment for investors, with a likelihood of descending to the 2.168 mark. This potential movement creates an opportune moment for traders to engage with the trend following the correction's culmination.
THETAUSD Technical Indicators:
- Maintaining a position above the MA200 emphasizes a robust uptrend.
- The bullish sentiment is further supported by the Wave Oscillator, reinforcing the potential for upward movement.
Technical Analyst: Kittiampon Somboonsod
Source: visit Tradinglounge.com and learn From the Experts Join TradingLounge Here
See Previous: NEO/ U.S. dollar(NEOUSD)
TradingLounge Once Off SPECIAL DEAL: Here > 1 month Get 3 months.

Conclusion and Strategy Forward
As Theta Token navigates through its current phase of correction within an overarching bullish trend, both daily and 4-hour Elliott Wave analyses provide a comprehensive understanding of its potential trajectory. Investors and traders are advised to monitor the 2.168 level closely, as it represents a significant juncture that could offer lucrative entry points for joining the uptrend.
With technical indicators such as the MA200 and Wave Oscillator highlighting sustained positive momentum, the outlook for Theta Token remains optimistic. As we anticipate the completion of the current corrective phase and the initiation of the fifth wave, strategic positioning and vigilance are key to capitalizing on the unfolding opportunities within the THETAUSD market.