Elliott Wave Analysis of Visa Inc. (V) - September 20, 2024

In this Elliott Wave analysis of Visa Inc. (V) as of September 20, 2024, we will explore the stock's current price movements and wave structure. Our goal is to provide traders with insights into potential trading opportunities. We will examine both the daily and 1-hour charts to offer a comprehensive view of Visa's ongoing trend.

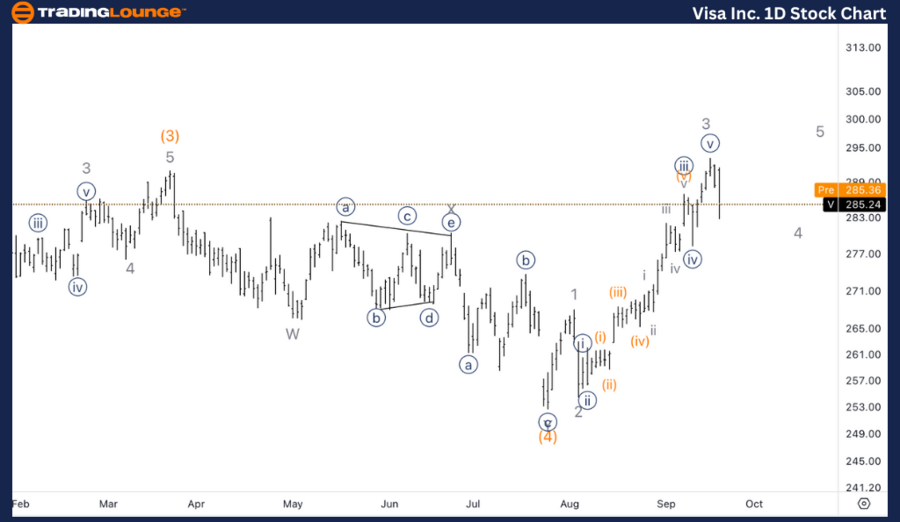
V Elliott Wave Analysis - Daily Chart

Visa Inc. (V) Daily Chart Analysis

V Elliott Wave Technical Analysis

Function: Trend

Mode: Impulsive

Structure: Motive

Position: Wave (5)

Direction: Upside into wave (5)

Details: Looking for new all-time highs (ATHs) within Wave (5) above $300, which aligns with Trading Level 3. At this point, we could either complete Wave (5) or see the development of Wave 1 of (5).

V Elliott Wave Technical Analysis – Daily Chart

This wave setup can potentially complete Wave (5) or act as the start of a larger bullish cycle, forming Wave 1 of (5). As Visa nears the $300 level, traders should monitor price action closely. A continuation higher could signal further upside potential, while a corrective pullback might indicate that Wave (5) has reached its conclusion.

Visa-Inc-1D-Stock-Ch...


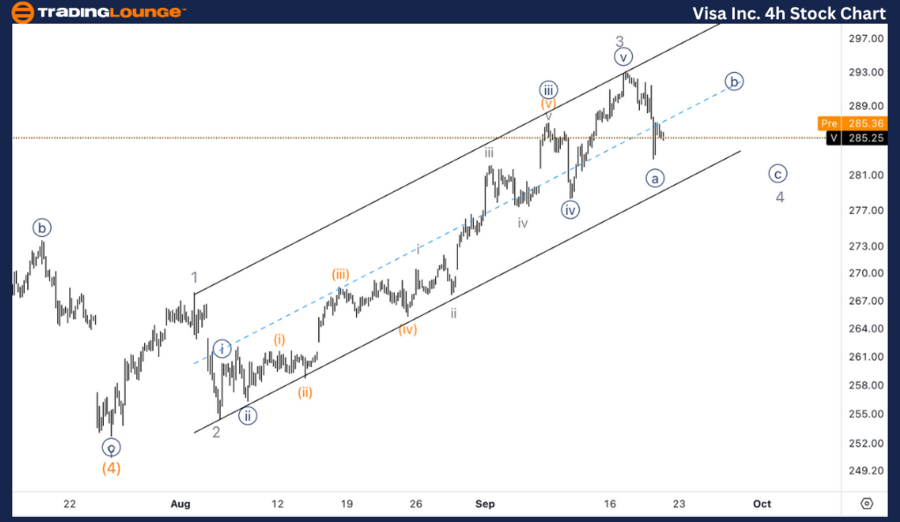
V Elliott Wave Analysis - TradingLounge 1-Hour Chart

Visa Inc. (V) 1H Chart Analysis

V Elliott Wave Technical Analysis

Function: Trend

Mode: Impulsive

Structure: Motive

Position: Wave {a} of 4

Direction: Seeking completion in Wave 4

Details: Expecting further developments within Wave 4, with Visa potentially heading toward $280, which aligns with the previous Wave {iv} structure.

V Elliott Wave Technical Analysis – 1H Chart

In the 1-hour chart, Visa is within Wave {a} of 4, indicating a corrective phase within Wave 4. The stock may move toward $280, a significant support level that coincides with the previous Wave {iv} zone. This area is a potential retracement zone, where the correction could find support before resuming the overall uptrend.

Technical Analyst: Alessio Barretta

Source: visit Tradinglounge.com and learn From the Experts Join TradingLounge Here 

See Previous: NextEra Energy Inc. (NEE) Elliott Wave Technical Analysis

VALUE Offer - Buy 1 Month & Get 3 Months!Click here

Access 7 Analysts Over 200 Markets Covered. Chat Room With Support

Visa-Inc-4H-Stock-Ch...

Related

Unlocking ASX Trading Success: REA GROUP LTD – REA Stock Analysis & Elliott Wave Technical Forecast

Unlocking ASX Trading Success: REA GROUP LTD – REA Stock Analysis & Elliott Wave Technical Forecast

Gain a comprehensive understanding of REA GROUP LTD with our in-depth stock analysis using Elliott W...

Read More >
Unlocking ASX Trading Success: V300AEQ ETF UNITS – VAS Stock Analysis & Elliott Wave Technical Forecast

Unlocking ASX Trading Success: V300AEQ ETF UNITS – VAS Stock Analysis & Elliott Wave Technical Forecast

This article provides a detailed Elliott Wave analysis of ASX: V300AEQ ETF (VAS), focusing on curren...

Read More >
ADANI POWER Stocks Elliott Wave Technical Analysis - Including Stock Price Targets, Stock Performance and Market Trends

ADANI POWER Stocks Elliott Wave Technical Analysis - Including Stock Price Targets, Stock Performance and Market Trends

This article provides an in-depth Elliott Wave analysis of ADANI Power, including stock price target...

Read More >
ASX Stock Trading Success: TRANSURBAN GROUP (TCL) Stock Forecast & TCL Elliott Wave Technical Analysis

ASX Stock Trading Success: TRANSURBAN GROUP (TCL) Stock Forecast & TCL Elliott Wave Technical Analysis

Explore the comprehensive Elliott Wave analysis of ASX TRANSURBAN GROUP (TCL). This analysis covers ...

Read More >
Exxon Mobil Inc.(XOM:NYSE) Elliott Wave Technical Analysis 9 January 24

Exxon Mobil Inc.(XOM:NYSE) Elliott Wave Technical Analysis 9 January 24

Exxon Mobil Corp.(XOM: NYSE) Elliott Wave Technical Analysis dated 4 January 24 with 4-Hour and 1-Ho...

Read More >
Gold XAUUSD Commodity Elliott Wave Analysis: Explore the Current Price Trends, Wave Structures, and Future Projections

Gold XAUUSD Commodity Elliott Wave Analysis: Explore the Current Price Trends, Wave Structures, and Future Projections

In this comprehensive Gold Elliott Wave Analysis, we explore the current price trends, wave structur...

Read More >

$1 for 2 Weeks

then $29 a month!

What a Special Offer!

Trade Recommendations

Unleash the power of deversified trading with our comprehensive portfolio, covering 250+ markets:

  • Stock Trades
  • Crypto Trades
  • Forex Trades
  • Commodity Trades
Elliott Wave Analysis

Gain a competitive edge with expert insights and AI-powered Elliott Wave charting into:

  • Global Indices
  • US Stocks & ASX Stocks
  • Forex & Crypto
  • Commodities
Top-Notch Trading Tools

Equip yourself with the tools of success:

  • Real-time Chat rooms
  • Elliott Wave Algorithm
  • Portfolio tools
  • TradingLevels
  • Screener
  • Trading Game
7 Elliott Wave Analysts

Stay ahead of the market with daily charts and insightful videos
Your secret to strategic trading!

JOIN HERE


Welcome to TradingLounge (ASIC A.R.No. 321187), specialists in trades, trading education and technical analysis, covering stocks, indices, commodities, forex and cryptocurrencies.

When you join TradingLounge you have access to everything we offer, including trade tools, educational content and a social platform to chat with like-minded investors.

Read more

@Copyright 2024 by tradinglounge.com

Contact Us

Australian no: 02 4787 6020

International no: +61 (2) 47876020

Pay with:

Find us on